Letter number 111 of March 2018
- TOPIC
- STATISTICS
- RESEARCH
- QUESTIONS & COMMENTS
- NEW
News : 2008/2018/2028 (1/2)
The French Association of Corporate Treasurers (AFTE) asked us to deliver a speech at its conference in November 2017 on 2007-2017-2027, 10 years of crisis and what’s next? Below follows a transcription thereof which will be split between this Newsletter and the following one.
We deal with the subject in seven points:
1/Liquidity
In mid-November 2008, the HEC MBA class organised a conference with financial directors on the difficulties being experienced at that time. One of them, Thierry Moulonguet, financial director of Renault, told us straight out: “I don’t know how we’ll be able to pay the salaries of Renault employees at the end of the month.”
The fact that a group as big as Renault did not know how it was going to cover its employees’ salaries at the end of the month and that it was short of cash was a huge surprise for many of the conference attendees. But the fact that the financial director was willing to share this very sensitive piece of information with around 100 students was a second reason for stupefaction. But when everything is collapsing…
This was obviously not an isolated example. Liquidity, which is supposed to be everywhere and always available (the basis of the IASB willingness, since abandoned, to generalise the notion of full fair value), was showing its true nature – cyclical and volatile.
Corporate treasurers responded to this challenge mainly in two ways:
- By increasing the share of cash and cash equivalents held on the asset side of the balance sheet from 2.5% of total assets in 2007 to 3.5% in 2016 in Europe. In the US from 4.5% to 5.5%, in Japan from 4.5% to 6.5% and from 3.5% to 4.5% in the rest of the world.
- With confirmed and undrawn credit lines for which statistics are rare.
- By diversifying their sources of financing: factoring (which worldwide increased from an annual volume of €1,325 to 2,376bn between 2008 and 2016, and which is used very large groups such as Total or Sanofi), bond market, private placements (Euro PP, USPP, Schuldschein), crowdlending, etc.
The share of bank financing in the eurozone fell from 85% to 78%. In the US, it is 23% compared with 77% for stock market products.
This trend is set to continue because it is in the interest of companies all the more so since technology and regulation are developing to facilitate this development.
One might think that technology enabling instant payments/transfers could make it possible to reduce the share of cash on balance sheets. However, the North American example (where cash accounts for 5.5% of balance sheets) seems to show that market financings require stronger precautionary credit lines. So, all in all, it is doubtful that these amounts could be significantly reduced. And when one has been through an experience like that of autumn 2008, one is careful in the future to take precautions.
This does not have a negative impact on the value of companies because the majority thinking in this area is the use of EBITDA or EBIT multiples to get enterprise value, from which we deduct net bank and financial debt to arrive at the value of equity[1], rather than using the P/E ratio.
Although companies currently have abundant liquidity, it is clear that this situation is atypical and that it will not last forever. Let’s hope that treasurers don’t adopt bad habits!
2/Academic research
There are around 4,000 to 5,000 financial researchers worldwide who do a bit of teaching and a lot of research. Their productivity is structurally low as in any fundamental research activity. The main advances recorded over the last 10 years include:
- John Graham, Thierry Philippon, and Heitor Almeida confirming that the value of tax saving due to debt is equivalent to the value of the increased negative internalities engendered by substantial debt. Taking out debt does not create value in itself, nor does it make it possible to reduce the cost of capital[2].
- Laurent Frésard showing the strategic advantage of cash which makes it possible to gain market share up against competitors who have less cash.
- And behavioural finance which explains anomalies on efficient markets by the real behaviour of individuals with limited rationality (when they need cash, most treasurers will spontaneously sell money funds which are making profits rather than lose money). Although more centred on market finance, behavioural finance explains why financial directors who lived through the 1929 crisis prefer equity, and those who were in the marines prefer debt. Its founding father, Richard Thaler, won the Nobel Prize for Economics a few months ago.
Current research in corporate finance is taking a particular look at the influence of covenants on corporate transactions and will no doubt provide material for another conference in 10 years’ time.
3/The cost of capital
At the conference in mid-November 2008 which we referred to at the beginning of this article, the financial director of LVMH had very little to say for himself. It is true that he was taking advantage of the group’s low level of debt to buy Hermès shares which had been massacred along with the rest of the market. They were sold a few years later, generating an after-tax capital gain for LVMH of €2.7bn.
This example is a perfect illustration of the advantages of financial flexibility, which gets a lot more accolades for a financial director than an illusory and hypothetical reduction in the cost of capital resulting from an apparently optimum debt level, something we have never believed in[3].
In addition to the research referred to above, the drop in the corporation tax rate from 38% to 25% by 2022 in France, from 30% to 19% in the UK and 35% to 21% in the US along with the low interest rates, throw doubt on the value of the tax benefits of debt, all the more so given that there is a trend towards limiting tax deductibility of interests in Germany, Italy, Spain and the US, to 30% of EBITDA and to 75% above €3m in France.
The problem today in the cost of capital area is that of persistence of vision which means that companies are slow to adjust their cost of capital downwards due to lower interest rates. So, you get this major non-cyclical consumer goods group with the CEO stating a cost of capital of 7.5%, the annual report stating 6.9% and which works out at around 5 to 6%.
There is a risk of missing out on investment opportunities, even though it is understandable that groups are reticent when it comes to lowering their cost of capital fearing that operational managers will simultaneously decrease cash flows in their business plans. There is also the fear of having to depreciate goodwill in a few years if interest rates rise.
The first risk is all the more important given that the world is continuing to change in two major directions – the digitalisation of companies and the ecological awareness of individuals and companies, which are creating opportunities and differentiations (acquisition of WhiteWave by Danone).
4/The economy
We note, very briefly as it is well established, the continued emergence of emerging countries from 35% of global GDP in 1990, to 50% in 2010 and 60% in 2020.
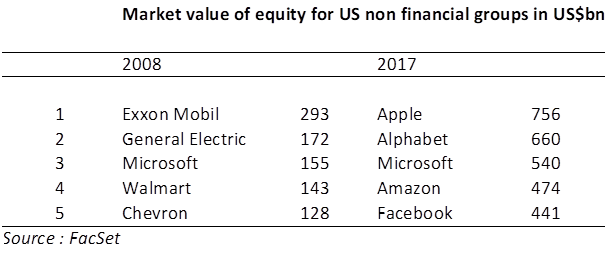
Simultaneously, the nature of groups in developed countries is changing as can be seen from the largest market capitalisations in the US over the last 10 years:
The largest two market caps in 2008, both industrial groups, are only ranked 7th and 11th respectively in 2017.
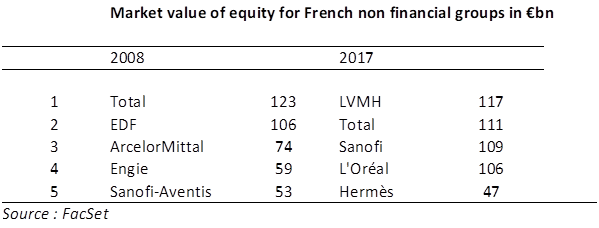
In France, there is a similar situation:
Luxury has replaced heavy industry at the top of the rankings and, as a result, the capital employed of the five largest market capitalisations has dropped by 37%. Since additionally, these industries have generous margins, requirements for external financing have fallen off substantially. While in 2008, only one French group among the five largest did not have significant debts (Sanofi), there are four out of five in this situation in 2017 (Total is the exception with net debts representing one-third of its market capitalisation and 1.6 times EBITDA).
Investments are increasingly immaterial, caricaturised by start-ups, financed by equity and a few by debt. This is why there is less need for debt, which means that interest rates are not being pushed up in developed countries.
Statistics : Venture capital in Europe in 2017
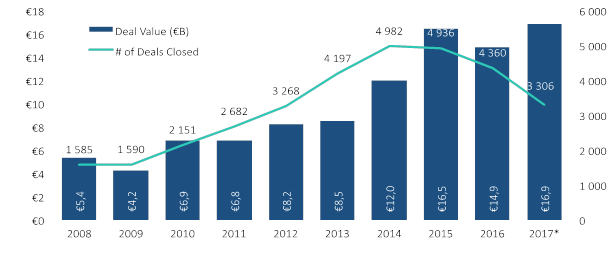
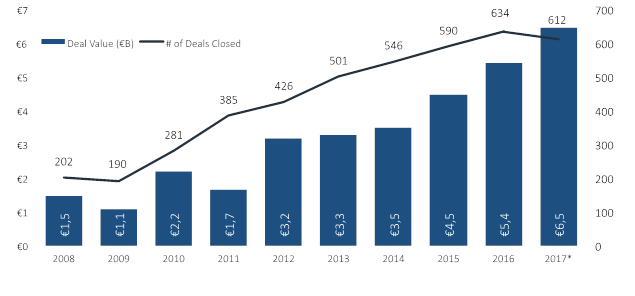
Investments in venture capital across Europe have reached a record high with around €17bn invested in 2017, according to Pitchbook's computations[1]:
On the other hand, compared to the high point reached in 2014 with 4,982 transactions recorded in Europe, 2017 marks the continuation of the decline in the number of operations recorded at 3,306, one-third less. Correlatively, the average size of each transaction recorded increases significantly, from around €3m since 2008 to €5.1m.
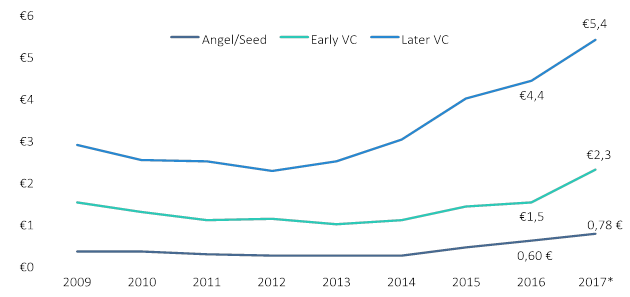
This evolution is at work for all types of investments: seed, business angels, and venture capital funds:
Several explanations coexist: after a period of strong growth in the number of investments made in this niche that tripled between 2008 and 2014, investors focus on their investment that have been successful and which require greater amounts of equity to continue their development. Moreover, even this segment of investment is not exempt from the general trend of soaring asset prices, following the crash in the price of risk caused by the monetary policies followed in Europe in recent years. If a few years ago, a good team, a good idea and a good PowerPoint presentation were worth €1m, today we are closer to 2 or €3 m€.
Finally, corporates are investing more and more in this type of assets with just under 40% of all venture capital investments including at least one corporate among investors, compared to just 30% 10 years ago. Here again the size effect plays.[2] :
[1] European Venture report 2017.
Research : Tax rates and financial decisions
With Simon Gueguen, Senior Lecturer at the University of Cergy-Pontoise
The article that we discuss this month[1] looks at tax rates used by corporate executives in their decision-making processes. Graham et al combined a qualitative approach, consisting of personal interviews with managers, with a standard quantitative approach. They show that the tax rates used in financial decisions by corporates are often the wrong ones and that this results in sub-optimal choices being made.
Theoretically, the right rate for assessing the consequences of a financial decision is the marginal tax rate (MTR), i.e. the (discounted) amount in extra tax paid on an additional euro of profits before tax. In their qualitative study, Graham et al interviewed 500 tax executives at listed and unlisted US firms, in the second half of 2007. They specifically asked them what tax rate they used for their forecasts and for making decisions. Fewer than 13% used the MTR. The most frequently used rates were:
- the official tax rate (OTR), (20% of cases for listed companies and 34% for unlisted companies);
- the average effective tax rate (ETR), i.e. the tax rate paid overall, and not marginally, by the firm (27% of cases for listed companies and 21% for unlisted companies).
For Graham et al, the main cause underlying these results comes from the behavioural bias of executives. They note firstly that the difference between the OTR (around 35% in the United States at that time) and the MTR is usually small, less than two percentage points. A standard behavioural bias would involve replacing a figure that is easy to obtain for a more complex figure when the difference is assumed to be small. Next, they note that the TIE, which corresponds to the tax rate published in the financial statements, is used much more often at listed companies than at unlisted ones. Here again, the fact of being influenced by information that is close or familiar (the term “salience” is used) is a well identified behavioural bias[2]. The argument of behavioural bias is further strengthened, according to Graham et al, by the fact that the use of the “wrong” rates is less frequent among executives with the highest level of education (would the latter be more rational because they are better educated?)
Next, an empirical study measures the consequences of these biased choices. It focuses on firms that use the ETR, instead of the MTR which is what the textbooks recommend. The choice of the financial structure is modified when the difference between the MTR and the ETR is significant. Financial leverage is more distant from optimal leverage. Graham et al believe that this incorrect choice results in a loss of value for the firm of around 0.25% of the book value of its assets (which corresponds to an average of $16m for the sample). This may seem like a small loss, but the other potentially negative consequences of this choice also need to be taken into account. For example, Graham et al show that the use of the wrong rate results in a slower response rate to investment prospects. They also raise the possible consequences in terms of R&D and M&A.
The takeaway from this article is that marginal decisions should be made using marginal rates (tax rates in this case), which is not always what happens, even at very large corporations!
[1] J.R.GRAHAM, M.HANLON, T.J.SHEVLIN and N.SHROFF (2017), Tax rate and corporate decision making, Review of Financial Studies, vol.30-9, pages 3128 à 3175.
[2] A comparable effect can be found in the article “Do managers overreact to salient risks? Evidence from hurricane strikes”, The Vernimmen.com Newsletter no. 101, February 2017
Q&A : Why does overvaluing inventories lead to loss reductions or profit anticipation?
In order to understand this subject properly, you need to imagine a company in which workers have spent a year making products that will only be sold the following year. They were paid 100. On top of that, the company purchased raw materials for 150 that were fully consumed in the production process. Finally, there are overheads of 20.
When the raw materials were purchased, cash available on the balance sheet was reduced by 150 and the line “Purchase of Raw Materials”, which is an income statement item, increased by 150.
When the workers were paid, cash available was reduced by 100, and the line ”Wages”, on the income statement, increased by 100.
When overheads were paid in the amount of 20, cash available was reduced by 20 and Other External Services on the income statement increased by 20.
At the end of the year, when the accounts are drawn up, expenses amount to 150 + 100 + 20 = 270 but no income on the other side because nothing has been sold. Which makes a loss of 270.
If the year had started with 270 in Equity on the balance sheet and 270 in cash available, then there would now be nothing left. The Equity of 270 has been gobbled up by the loss carried forward and the 270 of available cash was used to cover the three expenses for a total of 270, so it now stands at 0.
But hang on a minute! This is superficial and only true in appearance. We seem to have forgotten that somewhere, the company has produced goods that will be sold in the next financial year, but that have not yet been sold. However, these goods exist and so far we have seen no sign of them anywhere in the accounts. This shows that there is a problem.
So we’re going to correct this problem by recognising that goods were produced and that they will be sold in the next financial year. To do so, we’re going to create an Inventories item on the balance sheet for the cost price of the inventories, here 100 in the production workers wages + 150 for raw materials = 250. To create this item on the balance sheet, we’re going to transfer the expenses of 250 that we wrongly recorded as an expense on the income statement. Wrongly because at the end of the financial year, we realised that this expense was attached not to products sold during the course of the financial year, but during the course of the following financial year. At the time when we recorded it as an expense, we didn’t yet know that it would be integrated into products that wouldn’t be sold during the course of this year, but during the course of the following year. So at that time, it wasn’t a mistake. We are only adjusting it after the fact when we know whether the inventories have been sold or not.
To make this adjustment, we created another item on the income statement, under income, Change in Inventory for 100 + 150 = 250 and it is set off by Inventories on the asset side of the balance sheet for the same amount of 250.
All in all, we now have an income statement with income of 250 (Change in Inventory) and expenses of 270, making a loss of 20 corresponding in this example to overheads which have to be covered every year regardless of what happens and which are not linked to production. And on the balance sheet we have 250 in Inventories, 0 in Cash and 250 in Equity (the 270 initially contributed less the loss of 20). So it all balances out nicely.
If you had decided, contrary to all accounting rules, to value your inventories at 270 by including overheads, you’d have had 270 under Change in inventory on your income statement and so earnings for the financial year of 270 - 270 = 0 and Inventories on the balance sheet for 270 with Equity of 270.
Next year, when you want to sell your inventories, if you had valued them at 270, you’d make a profit, the difference between the sale price and the cost price, which would be less by 20 if you had valued your inventories at 250.
So, including excessive expenses in Inventories, even if your auditors don’t say anything (which in itself should raise eyebrows) leads to the transfer of a loss from a current financial year to a future financial year because in the first case, you deducted 250 in expenses from the income statement thanks to Change in Inventories and in the second case 270. In the first case you have a loss the first year of 20 and in the second case 0, but in this second case, you reduce your profit the following year by 20 (or you increase your loss the following year by 20).
New : COMMENTS
Regularly on the Vernimmen.com Facebook page[1] we publish comments on financial news that we deem to be of interest. Here are some of the comments published over the last month.
M&A
AXA buys XL for € 12.4bn and is down on the stock market by € 5.9bn: the price of not respecting its word?
Yesterday with the announcement of this deal, which increases the insurance assets of AXA (in business damage insurance) and reduces the weight of those in the management of savings in accordance with the strategy announced, the share price fell by 9.7%. The premium paid is not low (about 40% on an average over several months, or €3.5bn), but there are also synergies (announced at $0.4bn per year, which does not seem excessive). Without taking it into account, it is therefore €2.4bn in value loss because a few months ago the president of AXA announced not wanting to do large acquisitions, but simply some between €1 and €3bn€. Those of you with some grey hairs remember that AXA's acquisition of Equitable in the United States in 1991 also caused a lot of disruption to the stock market. This is the deal that allowed AXA to stop being a group focused on France, and to successfully take on a global scale. What the stock market, not stubborn, recognized afterwards.
In short, opportunities are made to be seized and there are only fools who do not change their minds. If AXA succeeds in this integration, investors will show it quickly after this bust of anger.
Return on tangible equity
Most banks, in the publication of their 2017 results, put forward the criterion of the return on tangible equity. This ratio is computed on the shareholders' equity of the group from which the intangible assets are deducted.
In prudential matters, the solvency ratios of banks are computed after deduction of intangible items, which is quite logical, because if a bank has solvency problems, it is doubtful whether its intangible assets (mainly goodwill and brands) still have significant value.
To calculate the return on equity in the same way seems to us unfair. Indeed, this portion of equity that disappears in the calculation of the return on tangible equity, under the pretext that it is used to finance intangibles, was contributed one way or another by shareholders. It is still on the balance sheet of the bank and shareholders continue to expect on this equity they own a certain return. If this calculation is done and put forward, it is of course that it allows to display profitability figures more flattering than those resulting from a classic calculation of the return on equity, classic but especially more rigorous and often relegated to second place. Without heartache, we can note that banks that have lost billions or tens of billions of euros of capital (Citi, UBS, Deutsche Bank, RBS, Bank of America Merrill Lynch, Unicredit, etc.) already benefit from a powerful effect of boosting their returns on equity, since these losses have eaten parts of the equity that have disappeared from their balance sheet without the shareholders having to settle for a zero return on these funds.
