Letter number 130 of June 2020
- TOPIC
- STATISTICS
- RESEARCH
- QUESTIONS & COMMENTS
News : What's new and what's the same in the rankings of the world's largest market capitalizations since 2000
Every 3 years we update the data tables in the Vernimmen appendices of the largest 20 market capitalisations in 14 countries or economic zones: market capitalisations, beta, P/B ratio and P/E ratio, sales, net income and headcount.
This database, which has been built progressively, makes it possible to make long-term observations, admittedly based only the largest 20 market capitalisations in a country, but these often represent a significant part of the market capitalisation of this country, 60% in the French case for example.
Here, we have limited ourselves to 12 countries, leaving aside the Maghreb and the WAEMU (West African Economic and Monetary Union). The BRICs (Brazil, Russia, India and China) are taken into account from 2008 and were not included in the appendices before this date.
The figures correspond to those of April or May of each year, so almost at the height of the TMT (Telecom, Media and Technology, which then included the Internet) bubble in 2000 and at the end of the lockdown in continental Europe for 2020. The percentages or rankings given are based on values in €bn and not on the number of companies.
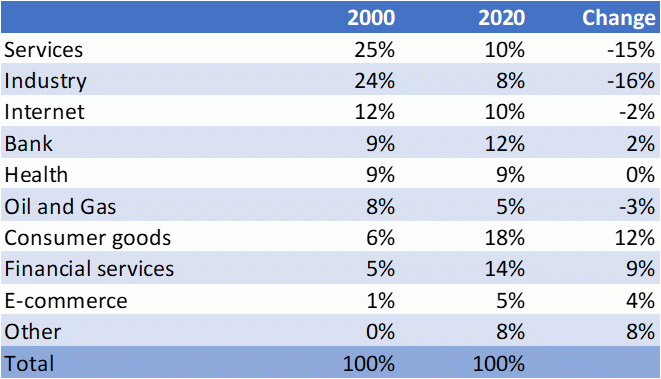
From a sector point of view, what is striking is the collapse of industry, which went from the top position with 25% of market capitalizations in 2000 to only 10% in 2020. General Electric is a symbol of this trend with a market capitalization of €521bn in 2000, which made it the largest market capitalization worldwide[1] and which has not featured among the top 20 in the US since 2018. This tells us that there is less need for objects and greater demand for services among the wealthiest humans on the planet, but also highlights the effects of globalisation (China, workshop of the world) forcing the economic returns of the industry to converge at costs of capital, and therefore decreasing values.
One might think that it was healthcare and the Internet that took over from the industry. Not at all. Certainly in 2000, Facebook, Google or Tencent did not exist or were far from being among the top 20 capitalisations of their respective countries, but in the midst of a TMT bubble, Cisco (3rd largest market capitalisation) was worth €465bn (only one-third of that amount today), a little more than Facebook in 2020, America Online was worth €131bn, T-Online was worth €42bn, two-thirds of what its parent company Deutsche Telekom is worth today, etc.
As for healthcare, with a stable share over 20 years at 9% of market capitalisations, Aventis + Sanofi-Synthélabo already together constituted the 3rd largest French market capitalisation, at €93bn (compared to €110bn today), Pfizer, Merck and Johnson & Johnson were already the 6th, 13th and 18th largest market capitalisations in the US; Novartis and Roche are the 1st and 3rd largest in Switzerland.
No, the rising champion is consumer goods, which rose from 6% to 18% of market capitalisations, mainly thanks to Apple (6% of the total in our sample in 2020, absent in 2000) and luxury goods (from 0.4 to 2.3%). It's astonishing to think that LVMH was worth a quarter of Orange at the height of the TMT bubble, compared with 6 times more in 2020. But we also have Nestlé, Unilever and Danone which grew much faster than our sample: x 2.9 against x 1.6; especially thanks to Nestlé (x 3.4), the world leader in the food industry, the 11th largest market capitalisation in the world, worth almost as much as the world's leading traditional retailer, Walmart.
Although the share of services has increased little, from 30 to 32%, the change within this category is astounding! Traditional services fell from 25% to 10%, non-existent e-commerce jumped to 8% with the 3rd largest capitalisation worldwide (Amazon) and the largest in China (Alibaba), and financial services (insurance, but above all the payment industry) rose from 5 to 14%. Did any of us realise that Visa and Mastercard alone make up almost 3% of market capitalizations worldwide in our sample? Overall, this demonstrates the very good performance of the banking sector, which rose from 9 to 12% despite the exit from its scope of Visa and Mastercard, which were previously subsidiaries of banks.
* * *
Geographically, the changes in twenty years are also striking.
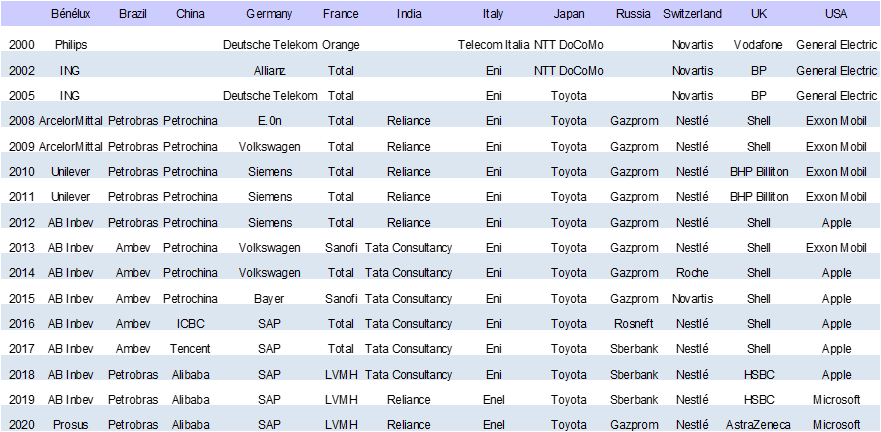
Despite the introduction in 2008 into our sample of China, Russia, Brazil and India which represented 26% of the market capitalisations that year, the share of the United States remained stable at 46% between 2000 and 2020, despite a fall to 25% in 2008, thanks to a constant rise since then, and even accelerated in 2020 rising over 12 months from 41 to 46% of the total. Although the United States held six of the top market capitalisations in 2000 with General Electric, Intel, Cisco, Microsoft, Exxon Mobil and Pfizer, in 2020 they held the top four (Microsoft, Apple, Amazon and Alphabet) and 8 of the top 10. However, their top four capitalisations, which represented 17% of the worldwide sample in 2000, make up 23% in 2020.
While to feature among the US top 20 in 2000, a group needed to have a market capitalization of €117bn, in 2020, it was necessary to have €178bn. Only one Japanese group (Toyota), three Swiss groups (Nestlé, Roche and Novartis) and five Chinese groups (Alibaba, Tencent, ICBC, Kweichow Moutai and China Construction Bank) would be included today.
The second country, which went from 10% of market capitalisations to 16%, is of course Mainland China, officially still a communist country J. Its top twenty market capitalizations are quite heterogeneous as evidenced by a ratio of 1 to 11 between the first (Alibaba) and the last (Industrial Bank), compared with 1 to 7 in the United States and in most other countries (except Switzerland at 14). The annual replacement rate[2] of the top 20 at 13% is the highest observed (from 7 to 10% for other countries), proof that behind its peloton of ten large groups, the situation is changing.
Behind China, we find Japan, Switzerland, France and the United Kingdom, bunched together in this order in 2020, and each representing 6 to 7% of the total, with a real performance of the Swiss groups rising from 5% in 2000 to 7% in 2020, despite the introduction of BRICs in 2008 in our sample, which mechanically dilutes positions. And despite its population of only 9 million, compared to 67 million in the UK and France and 126 million in Japan. The latter is in net decline (from 14 to 7%), as is the United Kingdom (from 15 to 6%). For the latter two countries, the decline is absolute, with the combined value of their top twenty market capitalisations falling by 21% and 32% respectively against + 60% for Switzerland and + 13% for France.
Germany now represents only 5% compared to 8% of market capitalisations in 2000, and an absolute amount of its market capitalisations stable. Even though its industry has taken significant market shares, it is penalised by the relative decline of this type of activity and its lower valuation multiples: thus its 8 industrial groups are worth half as much in 2020 than the 8 French consumer goods groups (€378bn versus €689bn). It is also likely that Germany is penalised in this type of classification by its large number of mid-sized companies, which, since they have not been consolidated into large groups, are less powerful than in other countries where mid-sized companies have become rarer (France, United Kingdom) due to the appetite of large groups.
Two countries stand out for their constant poor performance: Italy, which made up only 2% of the total in 2020 (5% in 2000), with a 44% drop in the absolute amount of its market capitalizations. While in 2000 a company had to have a market capitalization of €8bn to feature among the Italian top 20, it only takes €6bn in 2020 (compared with €20 to 25bn for the Swiss, UK, German and French groups). Its top group (Enel, €61bn) ranks 72nd in the world.
Russia is experiencing an even more rapid decline, going from 7% in 2008 to 2% in 2020. Its top group, Gazprom (€54bn) is ranked 80th in the world, as much as Axa, 13th in France. A market capitalisation of €5bn is enough be among the Russian top 20, the smallest figure in our sample. Although a political and military power, Russia is an economic dwarf.
Its top 20 are worth as much as one-third of Switzerland, one-seventh of China and one-twentieth of the United States. Three-quarters of its top 20 groups are in the commodities sectors and of the top 13, only one is in another sector (Sberbank, which must however have de facto a lot of loans in this sector!). The often-criticised governance of its listed groups obviously does not help them to obtain high valuations.
India is stable at 4%. Brazil is evolving in a similar way to Russia, with very wide sectoral diversification, and now only accounts for 2% of the market capitalisations in our sample.
[1] For further details, see the Vernimmen.com Newsletter No. 117, December 2018.
[2] Likelihood of a group being ejected from the top 20 market capitalisations in its country in a given year
Statistics : Corporate income tax in the world
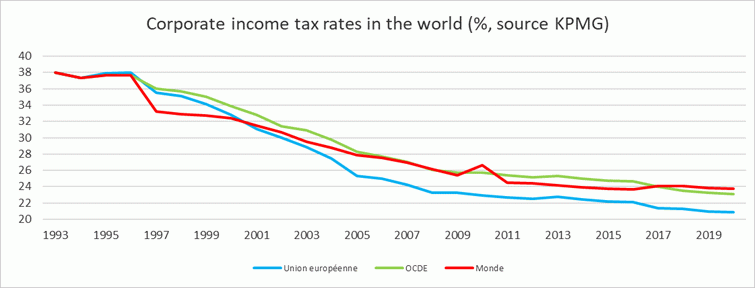
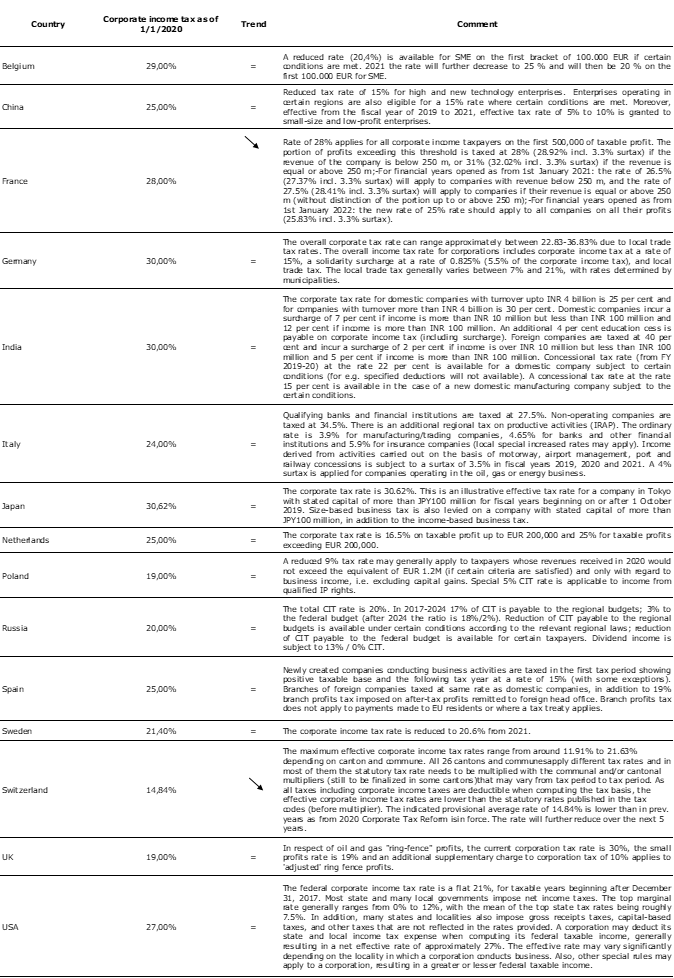
Corporate income tax in the world have stabilised at c. 24%. They keep reducing in Europe (for example in France or Switzerland) where they are now close to 20% in average.
Research : Long-term relationships in bank loan agreements
With the collaboration of Simon Gueguen, lecturer-researcher at CY Cergy Paris University
The importance of the lender-borrower relationship in the formation of loan agreements has long been known. However, for bank lending, a rigorous empirical assessment of the effects of this relationship is difficult. The objective is to compare "transaction loans", whose negotiation depends on the precise situation of the borrower at the time of granting (transaction by transaction), and "relationship loans", whose negotiation depends on the relationship between the bank and the borrower (over the long term). The difficulty arises from the fact that the construction of a long-term relationship is not independent of the characteristics of the borrower. The article we present this month[1] overcomes this difficulty by exploiting an original database.
Schafer uses a 2011 European Bank for Reconstruction and Development (EBRD) study of banks in Central and Eastern Europe. These banks were asked to indicate the importance of different criteria when making lending decisions to enterprises. In particular, banks were asked to indicate the importance they attach to the relationship with the client on the one hand, and to financial information on the other.
The article performs its analysis on the 15 Armenian banks in the study (due to the possibility of cross-referencing the data with a detailed credit register for this country). For all these banks, the relationship with the client is considered very important for lending to large companies. The difference is on loans to SMEs: 6 banks are more "transaction-based", the other 9 are more "relationship-based". It is therefore possible to compare loans granted to the same company according to the two practices. In addition, each bank had the option of defining the threshold separating SMEs from large firms itself. This creates threshold effects that can be used in the econometric analysis.
In the sample studied, relationship banks are much more tolerant of short-term problems than transaction banks. The probability of late payment is 50% higher for relationship-based loans than for transaction-based loans (for the same company). Late payments seem to be better accepted when the bank focuses on the long-term relationship. On the other hand, the default rate at maturity is not different between the two practices. More importantly, Shafer finds that the profitability of the loan for the bank, taking into account both interest and the default rate, is higher for relationship-based loans. In other words, the relational-based loan consists in agreeing to finance the firm in a liquidity crisis, and then generating a long-term annuity linked to the knowledge of the client.
Although these results are based on a small sample, they are useful in informing the theoretical debate on the importance of the lender-borrower relationship. The lending relationship makes sense in a situation of information asymmetry. By entering into a long-term relationship with its clients, the bank acquires detailed knowledge of their situation, and can thus make better decisions and ensure better monitoring of its loans. In particular, the article supports the theoretical proposition put forward by the German economist Von Thadden[2], that this informational advantage can translate into both poor short-term results and better long-term performance. Consequently, the relationship-based loan acts as a form of liquidity insurance provided by the bank. This insurance pays off, since the bank ultimately earns more on these loans.
Q&A : How does European law define companies in financial distress?
The concept of financial distress under European law is particularly important as it will limit the ability of public bodies to provide financial assistance to such companies.
For example, during the Covid-19 crisis, companies in financial distress were unable to obtain state-guaranteed loans.
A firm is considered to be in financial distress if it is under collective proceedings (so far nothing shocking) and/or if:
(share capital + share premium) / 2 + reserves +/- retained earnings +/- income > 0
That is, if the retained earnings and negative results are more than half of the share capital and premiums.
Our reader accustomed to reasoning in terms of shareholders' equity will have noticed that the ratio can be negative even though shareholders' equity is positive.
Thus in the following example:
Share capital: 100
Share premium: 300
Reserves: 50
Results carried forward: - 200
Net income: - 100
Total shareholders' equity: 150
Ratio: (100 + 300)/2 + 50 - 200 - 100 = - 50
In this case, the company will be able to return to a positive ratio by incorporating the accumulated losses (retained earnings and profits) into the share capital or by deducting them from premiums. Thus in our example:
Share capital: 100
Share premiums: 300 - 200 - 100 = 0
Reserves: 50
Carry forward: - 200 + 200 = 0
Result carried forward: - 100 + 100 = 0
Total shareholders' equity: 150
Ratio: (100 + 0)/2 + 50 + 0 + 0 = 100
In this case, the company will be able to return to a positive ratio by incorporating the accumulated losses into the share capital.
We are not opposed to rules limiting State aid to companies in difficulty, but for goodness' sake, why always over complexify things by inventing a new pseudo-financial ratio which depends largely on the accounting choices of the company? Can we not simply define as being in financial distress those companies that have negative equity?


