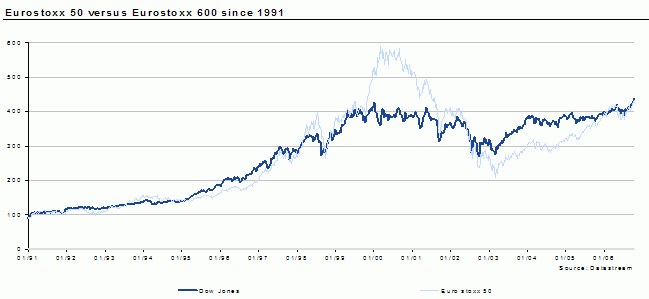
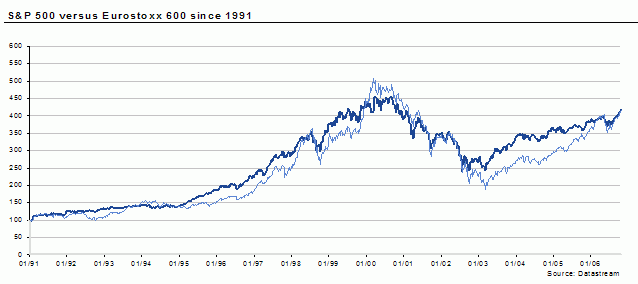
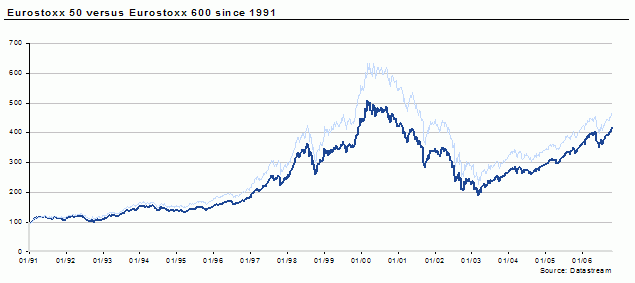
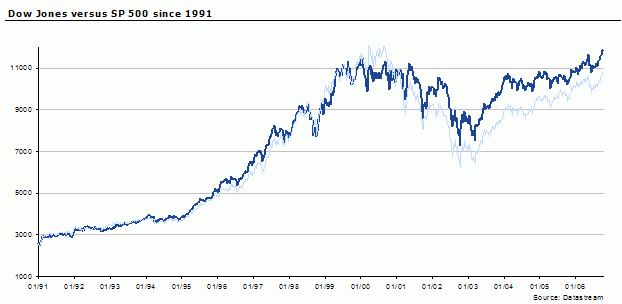
Why has the Dow Jones index risen above its historical high of 2000, while the Euro Stoxx 50 still has a long way to go, as illustrated by the relative performances of these two indices since 1991 (rebased at 100):
The explanation for this disconnection between the two US indices since 2000 is the small share of technology, media and telecoms (TMT) stocks on the Dow Jones and the larger share of industry stocks, which obviously withstood the bursting of the TMT bubble a lot better than TMT stocks did.
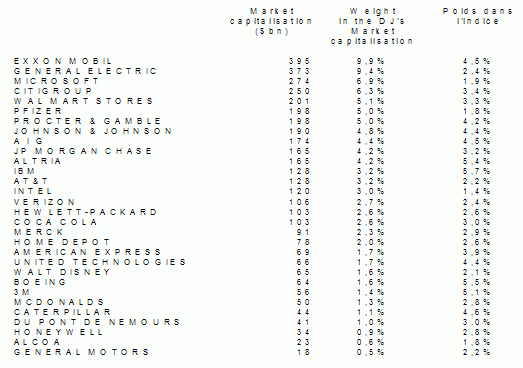
The reason why the Dow Jones is less representative than the Euro Stoxx 50 is because the market capitalisations of the companies listed on the Euro Stoxx 50 account for 38% of the euro zone market cap, compared with 26% for the companies listed on the Dow Jones as a percentage of the US market cap.
There is a logical explanation for this. Because the US stock market is twice the size of all of the stock markets in the euro zone put together (in terms of market capitalisation), an index containing only 30 firms in the USA compared with 50 for the Euro Stoxx 50, is likely to be less representative of its market than the Euro Stoxx 50 is of its market.
In addition, the specific way in which the Dow Jones is constructed helps to make it less representative. Also, among the 30 largest US market caps, only 18 are included on the Dow Jones index. The large market capitalisations that are missing include Bank of America (5th largest market cap), Berkshire Hathaway (13th), Cisco (14th), Chevron (15th), Google (16th), Wells Fargo (19th), Conoco Phillips (24th), Pepsi-Cola (25th), Oracle (26th), Wachovia (28th), Amgen (29th) and Genentech (30th).
On the other hand, it does include 3M (54th), McDonalds (61st), Dupont de Nemours (70th), Caterpillar (81st), Honeywell (89th), Alcoa (132nd) and General Motors (172nd).
The only big market caps missing from the Euro Stoxx 50 are EDF (4th biggest in terms of market cap but very small free float) Mittal Steel (27th), Banca Intesa (35th), GDF (42th), KBC Groupe (44th), BMW (48th), Inbev (49th) and Volkswagen (50th).
Finally and most importantly, the weighting of the stocks included on the Dow Jones index is totally disconnected from financial reality as they are not weighted on the basis of market capitalisations and free float (as is the case of European indices), but on the basis of stock prices. In other words, the weighting of General Motors, with its share trading at $35, is similar (2.3%) to that of General Electric (2.3%) which is also trading at $35, while the car maker has a market capitalisation of 18 times that of General Electric ($20bn compared with $365bn), the second largest market cap in the world.
Pfizer, which accounts for the second smallest share of the Dow Jones (1.8%) is the 9th largest US market capitalisation. IBM, which accounts for the largest share of the Dow Jones (6.1%) is the 17th largest US market capitalisation. If the Dow Jones were to include the Berkshire Hathaway stock, Warren Buffet’s company and 13th largest US market capitalisation, currently trading at around $100,000, it would account for 98.5% of the index! We can thus conclude, without much risk of being wrong, that the Dow Jones should change the way in which it calculates the index or the Omaha firm should carry out a massive split (1) if it hopes to join the Dow Jones index one day!
