Or on the basis of historical data relating to rates of returns received by investors since over very, very long periods. On efficient markets, historical rates of return should be equal to future rates of return. In this case we refer to the historical risk premium, based on the very pleasing principle that, over the very long term, we end up getting what we ask for.
3. Weaknesses of the historical premium
From a conceptual point of view, only the anticipated risk premium is acceptable for calculating a discount rate. The price of an asset today can only correspond to expected discounted cash flows that it should generate given the rate of return required by the investor today. So, the $ / € exchange rate is currently 1.35. It is at this price that it is possible to buy or sell the dollar, not at 1.10, even though this is the average exchange rate over the X previous years.
The historical premium has, de facto, three drawbacks:
• Given the volatility of annual returns recorded (annual rates of + 20 % or – 20 % are not unheard of (4)), calculations have to be based on data over a very long period in order to reduce the standard deviation of observations and to arrive at a relevant average (5). Even over 75 years, the theoretical standard deviation of observations following a normal rule is 2.5%, which means that a premium of 5%, for example, has as much chance of being 2.5% as 5% or 7.5%. So UBS (6) estimates that the risk premium for the USA, calculated by Ibbotson (7) since 1926, often cited and used (7.1% on arithmetical average and 5.2% on geometric average), would change by one point if it were calculated from 1925 or 1927.
• When markets are rising, as they have been since March 2003, the historic rate of return achieved increases and thus the risk premium calculated as an average including recent years in which performances were (very) good, rises, when, because the market is performing so well, rates of return required by shareholders fall. Similarly, when markets are falling (2000 to 2003), rates of return achieved are negative and bring down the historic average which takes them into account. At the same time, investors’ required returns rise (which explains a part or the whole of the fall). This is completely inconsistent
• Calculations of historical returns ignore the case of firms that went bankrupt over the period studied as this method only looks at the performance of share prices of firms still in existence today. However, the basis of a rate of return is the remuneration of the risk that a firm that goes bankrupt could generate only at a given moment. So it’s hardly surprising that using this method, we arrive at a higher risk premium (around 7%) than with the prospective method (just under 4% currently) as it ignores the case of investments with a -100% return (bankruptcy). It’s a bit like including only those who have passed all of their A-levels in a survey to measure the average level of education of all 18 year-olds (8).
4. Historical inconsistent use of premiums
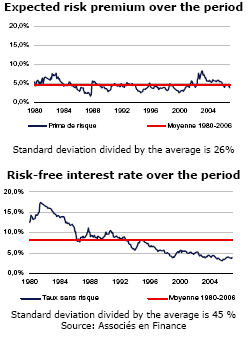
From a practical point of view, we see that those using the historical approach to the risk premium, often because they believe the current risk premium to be volatile, which is true, forget that the risk-free interest rate is even more volatile, as illustrated by figures for the French situation since 1980:
Accordingly, proponents of the historical approach could, on the basis of the same argument of volatility, be justified in calculating the average risk-free interest rate over a long period. They don’t do so of course, because they probably realise the absurdity of the result based on a parameter, the risk-free interest rate, that is readily available to all and sundry in the daily newspaper.
In addition, it is inconsistent, as can, unfortunately, often be observed, to calculate the risk premium (E (rm) – rf) using a given risk-free interest rate and in the formula r = rf + ß × (E (rm) – rf), replacing rf with a different figure from that used to calculate the risk premium (because most of the time we don’t know what risk-free interest rate was used to calculate the risk premium).
Finally, those with many years experience in calculating expected risk premiums know that when interest rates rise, as they have been doing for some time, the risk premium tends to fall. And also, the required rate of return doesn’t rise as high as the performance of the risk-free interest rate might lead one to assume, as the risk premium absorbs part of the rate hike. And vice versa in the event of a fall in interest rates. All things considered, the rate of return required by the shareholder, calculated using an expected risk premium is less volatile than the rate of return calculated using a constant risk premium.
5. To conclude
The reader will be well aware by now that we would strongly advise against using historical risk premiums in a practical financial operation. They may however be useful with a view to historical studies.
As there are several available sources for the expected risk premium and as over the very short term (a few days to a few weeks) they can, for technical reasons, be very volatile (9), averages of these various sources can be calculated over a period of a few (three?) months (10). There is a risk that averages calculated over longer periods could be disconnected from the market. So, for example, a figure arrived at in July 2006 (on the basis of estimations for the first half of 2006) is unlikely to be of much relevance in April 2007. Since January 2006, the CAC 40, the Dow Jones and the S&P 500 have risen by between 16 and 19%, although earnings forecasts have not been revised by this amount. Over the same period, the risk-free interest rate in Europe has risen by 80 points and in the USA by 45 points, resulting in a fall in the risk premium since this period of around 70 base points.
Finally, it is with regret that we note that new players in the field of finance, especially valuation experts, seem to think it necessary to hide behind studies of historical premiums for their valuations, just because they exist and because they can be submitted to a judge if ever they need to defend their figures before the courts. As if for the past 40 years, others, already cited in this article, had not been putting a lot of intellectual rigour and research into this area.
No expert worth his or her salt should arrive at a premium of 5% in 2007 (ne varietur), based on the average of a sample of 30 studies:
• one of which is pre-1965
• some of which only cite other studies in the sample which are then given twice as much weight
• two of which cover the Danish market (probably because “there is something rotten in the state of historic risk premia!”) while the rest of the sources mainly cover the US market
• with the same study cited twice because of a change in financial sponsor
• referring to financial text books which only cite the work of researchers without carrying out their own research (we’re in a good position to know!), quoted in editions that are more than 15 years old, even though they’ve been updated by their authors on a regular basis!


