Letter number 27 of October 2007
ALL ARTICLES
- TOPIC
- STATISTICS
- RESEARCH
- QUESTIONS & COMMENTS
News : Kyoto and carbon trading
The topic of carbon dioxide emissions may seem a far cry from our core competency, which is corporate finance. The truth is that the two subjects are closely connected, and this for several reasons. Firstly, targets for reducing emissions of greenhouse gases and the introduction of quotas for carbon emissions have major financial implications for certain industries (power generation, heavy industry). Next, because the mechanisms put in place for emissions trading are based on financial logic – a market. The emissions reduction project is a new industry that is experiencing strong growth. Finally, and perhaps from a more anecdotal point of view, because carbon emissions quotas can be an additional source of financing for the firm.
The emissions quotas market is today worth around €30bn, and could be worth €50bn by 2010.
1/ The carbon emissions quotas mechanism
The growing awareness of governments of all countries of the risks related to climate change has resulted in the signature of two international treaties (the United Nations Framework Convention on Climate Change, UNFCCC, signed in Rio and the Kyoto Protocol). The Kyoto Protocol, signed in 1998 and which entered into force in 2005, sets targets for reducing greenhouse gas emissions in developed countries (it was decided that imposing such reductions on developing countries would be likely to hamper their economic development). The target is a reduction of 5.2% of greenhouse gases for 38 countries by 2012. This target is on average 8% for members of the EU.
National targets for reducing emissions are a fixed at a state level, through the allocation of annual “Kyoto” quotas, that correspond to the number of tonnes of carbon dioxide that a country is entitled to emit under its Kyoto undertakings.
The innovative nature of the Kyoto Protocol is that it is based on flexibility mechanisms, allowing countries to modulate their emissions reduction targets.
There are two types of such flexibility mechanisms:
• market-based mechanisms, that enable emitters to buy rights to emit carbon dioxide in excess of the quotas that were initially set ;
• project-based mechanisms, that enable project developers to earn carbon emission credits. This is referred to as joint implementation (JI) and for developing countries, there is the clean development mechanism (CDM).
So, in order to meet its commitments to reduce greenhouse gases, a country has the option of (1) reducing its direct emissions through the introduction of public policies (bio-fuels, improving home insulation and energy consumption, restrictions on transport), (2) buying quotas from countries which have a surplus, or (3) buying emission credits created by a project mechanism.
Finally, in Europe, member states have decided to transmit a part of these quotas directly to the main industrial emitters of carbon dioxide, through a system of emission rights trading, known as the European Emission Trading Scheme (EU ETS). This market is open to all of the main industrial facilities responsible carbon dioxide emissions (11,500 facilities accounting for around 50% of carbon dioxide emissions in Europe have been targeted) which have been allocated carbon dioxide emission rights. These emission rights can either be used, carried forward to the next year, or sold on the market.
Every year (on April 30) accounts are drawn up in order to ensure that each facility has enough rights, given the volume of its carbon dioxide emissions. The first phase of this market (seen as a test phase) sets targets for the 2005-2007 period, and the second phase covers the 2008-2012 period. EU member states have already presented or will present by the close of 2007 their national quota allocation plans. Obviously, targets for periods after the 2008-2012 commitment period will be set in the future on the basis of climate change recorded and the success of previous plans.
The existence of a market makes it possible to reduce the cost of implementing emissions reduction schemes at a macro-economic level, thus facilitating the introduction of such schemes. If it costs a company less to reduce its emissions to below the set targets, it will be strongly motivated to do so as it will then be able to create emission rights that it can sell on the market at a profit. Another company, for which carbon dioxide emissions reductions may prove to be very expensive has the option of buying emissions rights on the market rather than carrying out the necessary transformation of its industrial facilities. In the end, the global level of pollution will have been reduced by the amount decided on by the state authorities. The market is there to ensure that industrial firms that find it easiest to reduce their emissions will to do so first, through the buying and selling of emission rights, which will make the emissions reduction process less painful for the economy as a whole. It is estimated that the existence of an emissions trading market will help to reduce the total cost of implementing the first Kyoto targets for Europe from €6.8bn to 3.7bn.
2/ The EUA market
The EUA (European Union Allowance) has become an underlying financial product. All of the players on the financial markets can buy or sell emissions rights, whether or not they are involved in industries that emit carbon dioxide or not!
A large share of quota trading takes place on the EUA market: €25bn or over four-fifths of trades. This is also a market that is experiencing strong growth (€5bn in 2005, €14bn in 2006).
There are a number of factors that determine the price of emission rights:
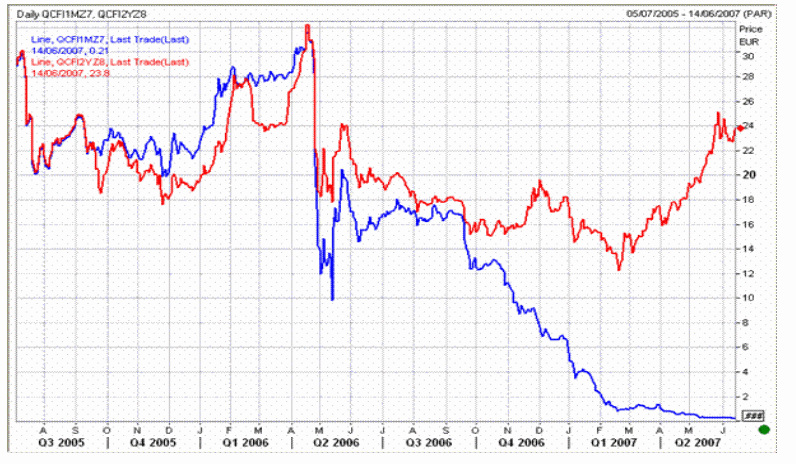
• the price of raw materials: some industrial facilities (especially power generation plants) have a choice as to the sources of power they use (each source producing different levels of carbon dioxide). The price of the EUA will thus have a major impact on industry. For example, if the EUA is trading at above €25, the use of high-grade coal instead of lignite becomes a viable option (savings on carbon dioxide emissions set off the higher cost of raw material) ;
• the authorised share of JI and CDM. Carbon dioxide emissions can in fact only be partially set off by the acquisition of JI/CDM ;
• technological changes and the speed with which industry introduces the carbon dioxide reduction processes ;
• the general health of the economy (which has a direct influence on energy consumption) ;
• weather conditions, which have an impact on the power output of wind farms and hydroelectric projects.
Quotas have been set at ambitious levels in order to create tension around EUA prices, encouraging firms to reduce their emissions. Nevertheless, as EUA prices are dependent on external factors that are difficult to forecast, prices are highly volatile.
The anniversary dates of checks on whether or not quotas for each site have been met are key dates for this market. This is when we see whether there is a shortage or surplus of EUAs compared with the report on actual physical emissions of carbon dioxide. For example, in May 2006, following the publication of actual emissions in 2005, it could be seen that allocations exceeded actual requirements (by around 4%), which resulted in a fall in the EUA price.
The EUA is a complementary product on the financial market, which is particularly interesting because it is largely disconnected from the performance of the financial market in general (so it has a low beta).
For the companies concerned, the EUA could be used as a collateral (just like for any other asset) for financings. EUAs have the advantage of being government-backed credits, which can be used to raise debt at a low cost.
For those wanting to read more on this subject, check out www.ft.com/carbon, consult the research paper published by Deutsche Bank, EU Emissions Trading, Kyotonomics: pricing carbon over 2008-2012, April 26, 2006.
Statistics : One share = one vote?
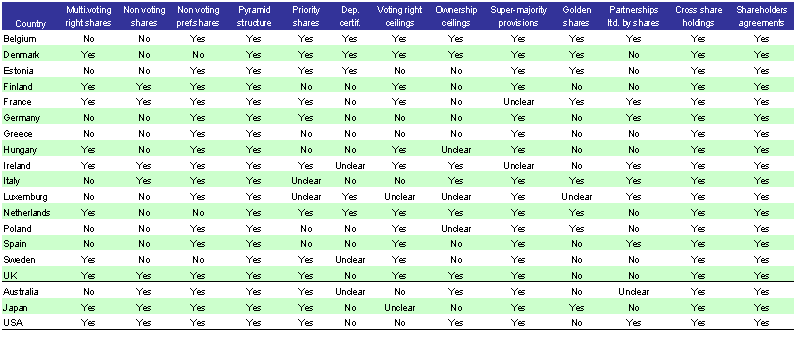
Shearman & Sterling, Institutional Shareholder Services (ISS) and ECGIC (European Corporate Governance Institute) have written a study commissioned by the European Commission on proportionality between ownership and control in EU listed companies (1) . They have studied control enhancing mechanisms which allow percentage of vote and percentage of shares to differ resulting in an absence of proportionality between ultimate economic risk and control. Among such mechanisms are non voting shares, pyramid structures, cross share holding, etc.
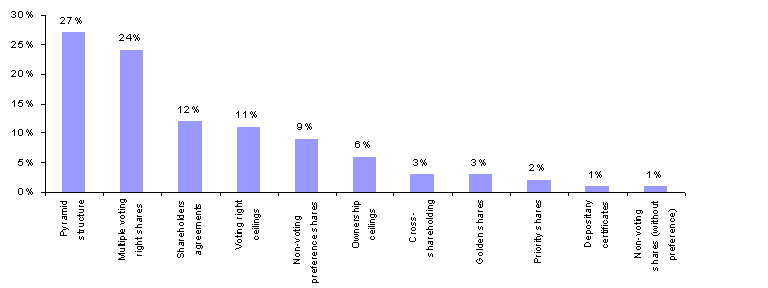
But this does not mean that they are effectively used by companies. The authors found, in a sample of 464 large and small listed European companies, that 56% had no such mechanism, and 27% use only one of them. Those figures are even higher for newly listed companies.
The most popular mechanisms are:
(1) Report on the Proportionality Principle in the European Union. A copy is available at: http://ec.europa.eu
Research : The impact of pension plans on betas
We know (1) that the difference between the value of assets backing pension plans and the net present value of a firm's pension plan commitments should be considered as a debt, to be deducted from entreprise value to compute the equity value of a company (2).
Jin, Merton and Bodie (3) draw our attention to a possible source of error that this (correct) line of reasoning could lead to if care is not taken to make provision for companies with low deficit (or net surplus) levels resulting from the difference between major assets and major pension related liabilities.
The problem arises when calculating the beta of the firm’s operating assets or unleveraged beta, indispensable for calculating the firm’s cost of capital (4).
The beta of operating assets is the weighted average of the beta of equity and the beta of net debt. Usually, the latter is assumed to be zero for companies that are obviously solvent. By including in the firm’s ordinary net debt the balance between assets backing pension plan commitments and the value of these commitments, we are implicitly suggesting that the beta of the backing assets and the beta of the pension plan commitments is the same, i.e. the one of net debt. This is a reasonable assumption when the backing assets are invested in debt securities, but it ceases to be so when they are mostly made up of equities.
Here is an example that illustrates the problem. A firm has an entreprise value of 100, a market capitalisation of 90 and a negative net balance of backing assets – value of pension plan commitments of 10. If the beta of the share is 1, the beta of the operating assets will be 0.9. Let’s assume now that the deficit of 10 results from the balance of a portfolio of assets for 70 (with a beta of 0.6) and pension plan commitments of 80, of which the beta can be estimated at 0.1 for example, given the risk of solvency which is no longer negligible. In this case, the beta of operating assets falls to 0.56 (5), which is nearly half of our original figure (0.90)!
Far from being a theoretical example, the authors show that the gap is sometimes bigger, as seen in the case of Boeing, Du Pont de Nemours, Eastman Kodak, and Textron. To summarise, we should never forget the popular saying: “Beware of small differences between large numbers!”
(1) See chapter 7 of the Vernimmen.
(2) For further details, see chapter 40 of the Vernimmen
(3) Do a firm’s equity returns reflect the risk of its pensions plans? Journal of Financial Economics, 2006.
(4) See chapter 23 of the Vernimmen
(5) (90 × 1 + 80 × 0.1 – 70 × 0.6) / 100 = 0.56.
Q&A : Should change in working capital be calculated as a gross or net figure on the cash flow statement?
On the cash flow statement (1), change in working capital is used to convert accounting aggregates (net income, depreciation and amortisation) into cash flow (in this case, cash flow from operating activities).
We would advise you to think in terms of net amounts for depreciation (inventories, receivables), because this will make it easier to identify the change more quickly, on the basis of balance sheet figures, for which the gross amounts are not always disclosed, even in an appendix.
This means that when working out the amount of cash flow, you shouldn’t add back write-down provisions on inventories and receivables to net income, as you would for depreciation and amortisation on fixed assets. We think that this is a better reflection of financial reality.
Here’s an example that illustrates what we mean:
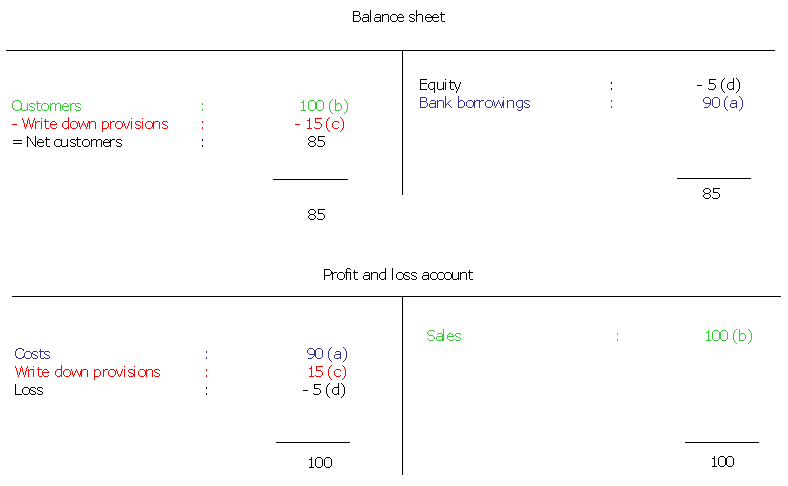
A firm starts out by producing for a cost price of 90 (a) goods sold at 100 (b) to customers who take delivery at year-end but who pay at the start of the following year (b). Suppliers are paid cash on delivery (a).
The firm thus needs working capital of 90. Let’s assume that it does not have any fixed assets to acquire (rental) and to simplify matters, that working capital is fully financed by bank borrowings.
Working capital, which corresponds conceptually and concretely to the difference in cash between the date on which suppliers are paid and the date on which customers settle, is thus 90. Change in working capital is also 90, as the firm has just been set up.
If the company has to write down receivables in the amount of 15 (c), working capital will appear on the balance sheet as 85.
(1) For more on cash flow statements, see chapter 5 of the Vernimmen.


