Letter number 46 of December 2009
ALL ARTICLES
- TOPIC
- STATISTICS
- RESEARCH
- QUESTIONS & COMMENTS
News : New rules for allocating goodwill:
key features for valuation
by Jean Pierre Colle and Philippe Leduc
(Grant Thornton Valuation services)
IFRS 3R on business combinations came into force in July 2009. This article sets out its key features that impact on valuations.
Key feature #1: 100% of the value of the target is definitively recognised on the date control is achieved
Under IFRS 3R, goodwill is calculated by working out the difference between the aggregate and the revalued net identifiable assets.
The aggregate is calculated by “valuing”:
• at fair value, the price paid for acquiring the controlling interest
• at fair value or at book value, the minority interests (non-controlling interests or NCIs),
• at fair value, the previously held investments.
… i.e., 100% of the target.
Whatever option is taken for valuing the NCIs (fair value or book value), the resulting aggregate and goodwill cannot be adjusted when the NCIs are subsequently acquired. Accordingly, their value calculated at the date on which control is achieved is frozen.
So, under IFRS 3R, 100% of the value of the target is recognised definitively at the date on which control is achieved, regardless of the percentage acquired. Consequently, greater importance is given to the accounts of the economic entity (which are drawn up for shareholders and holders of NCIs) than to the accounts of the parent company (which are only drawn up for shareholders).
Key feature #2: the fair value of contingent consideration must be included in the price paid
Generally, the payment of contingent consideration is triggered if the target exceeds certain earnings thresholds.
Under IFRS 3R, the acquirer is assumed to be capable of defining a valuation model that would measure the fair value of the contingent consideration reliably (IFRS 3R.BC 349), even if in most cases this turns out to be difficult.
In practice, the fair value of contingent consideration can be determined by calculating the weighted average consideration contingent on the likelihood of the occurrence of the various scenarios put forward by management.
The valuer should not merely rely on a “probability” valuation model. Forecasts should also be challenged. The stakes are not neutral. For example, if the target achieves better than forecast results:
• the contingent consideration effectively paid is more than the contingent consideration booked;
• the acquirer cannot increase goodwill and accordingly has to book the difference under expenses.
Some acquirers might be tempted to overestimate forecasts of the target’s post-acquisition results, and accordingly the initial goodwill. This would give rise to the “risk” of having to book income that at the very least would be viewed as contradictory if results achieved turn out to be lower than forecasts and, conversely, being confronted with the subsequent depreciation of goodwill.
Key feature #3: the fair value of NCIs or previously held interests does not necessarily correspond to the extrapolation of the price of the controlling interest
The fair value of NCIs or previously held interests should in most cases be determined by an expert.
This will not necessarily involve extrapolating a figure from the price of the controlling interest, especially when the company is not listed.
In these circumstances, the fair value corresponds to the price resulting from negotiations between holders of NCIs and a potential acquirer, which could be the majority shareholder or a third party.
IFRS 3R does not give cast iron instructions on how to value an NCI.
It restricts itself to stating that the price paid for taking control could include a control premium and that the value of an NCI could be impacted by a minority discount (IFRS 3R B45).
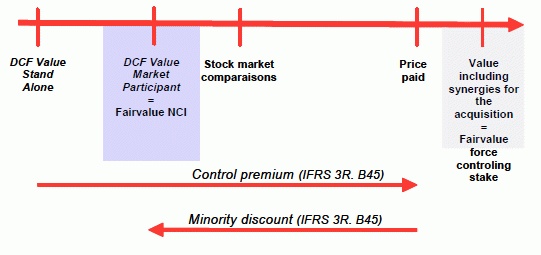
The diagram below provides an illustration of a possible approach for valuing an NCI:
In this diagram:
• the lowest value is the DCF stand alone value, which excludes all synergies
the intermediate value is the DCF Market Participant value, obtained by substituting the sector margin for the target’s margin and thus includes market synergies;
• the highest value is the majority interest which includes the acquirer’s synergies as well as those of the market. Here, it is even higher than the price paid in as far as, during the course of negotiations, the acquirer did not disclose all of the expected synergies;
• the expert estimated that they NCIs, if they had to be acquired, could benefit from market synergies not put in place by the seller. Accordingly, the expert suggests valuing the NCI on the basis of the DCF Market Participant value, which involves cancelling part of the control premium included in the price.
The advantage of this method is that it fixes the value of an NCI without imposing a lumpsum minority discount. It allows for the introduction of a certain amount of objectivity when valuing NCIs.
Key feature #4: by specifically getting rid of the reliability criterion for valuing intangibles, IFRS 3R rubber stamps the standard practice employed by valuers
Under the current IFRS 3, the reliability of the valuation is a condition for booking intangibles (IFRS 3.37c). However, it is specified in IFRS 3.BC 102 that it must always be possible to value an intangible asset for the purposes of a business combination.
Under this postulate, we see that for Purchase Price Allocations (PPAs), valuers agree to derive values that are not necessarily reliable.
The most common criticism levelled against PPA valuations are as follows:
• The PPA encourages the valuation of isolated assets such as brands, technologies or customer relations as opposed to the valuation of their content (i.e., the shares in the company holding these assets). It implicitly accords greater importance to the net asset value (NAV) method, which has for many years been neglected, except in special cases involving real estate and holding companies.
• The valuation methods generally used (Relief from royalty, Excess earnings) are specific to the exercise of PPA. The DCF method is not used, and rightly so, as this method is intended to value the whole and not isolated assets.
• The difference between the extreme values obtained using these methods is sometimes very large, especially when using the Relief from royalty method, given the wide disparity often seen in the royalty rates of comparable intangibles, such as those available on the public market. The multi-criteria method, which alone can make it possible to reduce this difference thanks to the use of other methods, is used too infrequently.
• Management is of the view that intangibles are not intended to be sold off individually and thus sets greater store by the accounting consequences of the valuation (future amortisation, impairment risk) than by the values obtained.
To summarise, by not including the reliability criterion mentioned under the existing IFRS 3, IFRS 3R confirms as correct the common practice of valuers. Notwithstanding the criticism levelled above, this is undeniably a step in the right direction. Trying to establish the motivations of the acquirer, understanding what the acquirer was wanting to buy and the resulting price, and finally translating them into the accounts, represent a great leap forward in terms of financial information.
Statistics : Liquidity and EBIT margins in times of crisis
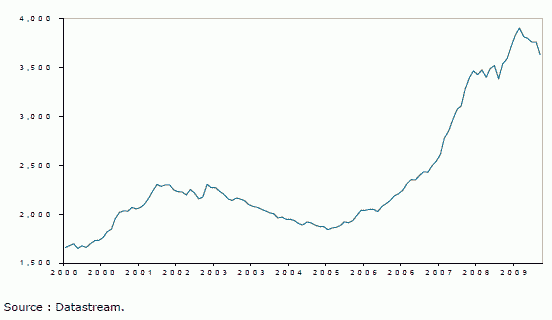
The first graph gives an idea of how many billions of US$ have fled in the USA in short-term risk-free assets that are yielding only 0.25% a year (it is better than a year ago when this yield was briefly negative!):
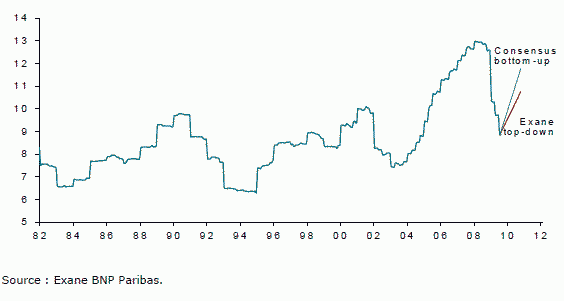
The second graph illustrates that even if the drop in EBIT margins was indeed sharp, the low point reached is actually above that of the previous economic crisis. This is one of the rules of break-even (1): the further away from it, the less the operational leverage. As for the rebound expected by stock market analysts, we will see what 2010 has in store!
(1) For more details, see chapter 10 of the Vernimmen.
Research : Are investors better off backing management or the project, the jockey or the horse?
The key factors behind the success of large firms have been the subject of numerous theories and empirical studies, since the seminal 1937 article on the subject by Ronald Coase (1). On the other hand, not much work covers the first years of a firm’s existence, given the difficulty in collecting data in this area. Kaplan et al recently published a study (2) of 50 companies, that starts with the implementation of their business plan and runs for three years after their IPO. The 50 companies making up the sample were all backed by a venture capitalist.
This study shows that venture capital firms are better off backing companies with solid, promising business plans, even when their management teams are not as high-powered and efficient as might be hoped. In other words, it’s better to bet on the horse than on the jockey.
The reason for this is that it is easier for a firm to change management than to change its business plan. Of the 50 firms in the sample, 49 continued to operate the same business with the same type of customer and competition. On the other hand, only 44% of CEOs in place three years after the IPO had been there at the time the business plan was drawn up.
The data collected are also used to draw up a description of the initial stages of the development of the listed companies:
• their growth is impressive: over the six-year period that separates the implementation of the business plan and the IPO +3, the median company grows from $0 to $43m, and its head count rises from 22 to 432;
• 46% of these firms cite management expertise as a key factor for success when the business plan is implemented, but management expertise is only mentioned by 16% of firms three years after their IPO;
• the founders hold an average stake of 31.7% of the share capital when the business plan is implemented, 12.5% at the time of the IPO and 3.2% three years later.
Accordingly, Kaplan et al call into question the claim made by the venture capitalist Arthur Rock, one of the first investors in Apple, that a top quality management team can, if necessary, change a firm’s business plan. They support the theory of Hannan and Freeman (3) which holds that the natural selection (creation and destruction) of firms plays a greater role in their adapting to the environment than any adaptation that they may undertake. The quality of the management team is important, especially when the company is being set up and the business plan is being defined. Steve Jobs is often stated to be the key reason behind the success of Apple, but eBay, Cisco and Google really took off after the departure of their founders.
The results of this article should be treated with caution. A sample of 50 IPOs is small and cannot guarantee robust statistical results. Moreover, 38 of these IPOs involved high tech companies, a sector in which there is a marked tendency for the young founding managers to sell their companies and move on. The article does, however, make an interesting contribution to our understanding of the initial stages of the development of listed firms.
(1) R.COASE (1937), The nature of the firm, Economica, n°4 p.386-405.
(2) S.N.KAPLAN, B.A.SENSOY and P. STRÖMBERG (2009), Should investors bet on the jockey or the horse? Evidence from the evolution of firms from early business plans to public companies, Journal of Finance, vol.64, p.75-115.
(3) M.HANNAN et J.FREEMAN (1984), Structural inertia and organizational change, American Sociological Review, n°49, p.149-164.
Q&A : What are Tobin’s Q, Jensen’s α, Sharpe and Treynor ratios
Tobin’s Q is a ratio comparing the market value of capital invested by a company with its replacement cost:
| Tobin’s Q = | Market value of invested capital |
| Replacement cost of capital |
From a practical point of view it is frequently computed as
| Equity market value + Liabilities book value | |
| Equity book value + Liabilities book value |
Some compute it by taking only into account equity values, they are wrong, it is not Tobin’s Q but the Price Book Ratio(1). When Tobin’s Q is above one, the company is pushed to invest more as the value of the invested capital is expected to be above the invested amount of capital. Value has hence been created.
Jensen’s α is the difference between the realised return on an asset or a portfolio and the theoretical return it should yield given its risk as measured by the CAPM (2). A positive alpha means that the asset is yielding more than it should, i.e. it was under priced. If the asset is a portfolio it means that the asset manager has a gift for stock pricing or simply that he/she was lucky.
When this is repeated year after year, talent is more probable and luck less likely! As an outstanding example, Johnson and Johnson the healthcare company has registered a return of 17.1 % per annum since 1944 (the year it was IPOed).
The Sharpe ratio is a measure of the excess return per unit of risk for an asset or a portfolio and is computed as
| Realised return – risk free rate of return | |
| Standard deviation of the excess return |
The higher the ratio, the higher the return for the same risk.
The Treynor ratio is also a ratio that allows for the ranking of several assets by return after risk adjustment. The risk taken into account is not the global risk (diversifiable or not as with the Sharpe ratio) but only the non diversifiable risk measured by the β of the asset.
It is computed for an asset or a portfolio as:
| Realised return – risk free rate | |
| β of the asset / portfolio |
(1)For more details on the PBR see chapter 27 of the Vernimmen.
(2) For more details on the CAPM see chapter 22.


