Letter number 49 of March 2010
ALL ARTICLES
- TOPIC
- STATISTICS
- RESEARCH
- QUESTIONS & COMMENTS
News : Financial crisis and multiples: European evidences
We have examined the effects of the current economic and financial crisis on multiples. The aim of the research is threefold: 1) to assess to what extent multiples are affected by crisis, assuming that corporate transactions should generally occur at a lower price during a downturn and multiples be consequently lower; 2) to highlight if crisis produce differentiated effects in various countries and financial systems; 3) to test if multiples are also affected by the circumstance that companies may or may not be listed on stock markets.
Sample Composition
The research has covered two years: 2006 and 2008, unanimously considered, respectively, as an expansion and a depression year. We have used 3 enterprise value (EV) multiples: EV/Sales; EV/EBITDA; EV/EBIT, because, commonly, they are: the most frequently employed, available also for the troubled and young companies, relatively difficult to manipulate and not as volatile as net earnings multiples.
We have considered only European countries with a minimum number of 25 annual transactions for both years: France, Germany, Italy, Netherlands, Spain and United Kingdom. They have been divided in two groups: bank based system (France, Germany, Italy and Spain) and market based system (Netherlands and United Kingdom).
The following table summarizes the sample:
The final sample comprises 511 deals in 2006 and 457 in 2008.
Deal multiples by country
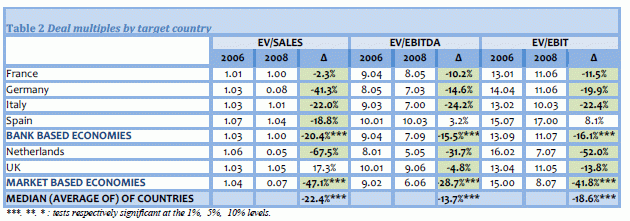
Table 2 provides evidence of the deal multiples by country and by financial system.
These evidences show a decrease of the median values of the multiples from 2006 to 2008. This trend is generalized and does not substantially change with the different multiples used (-22.4% for EV/SALES, -13.7% for EV/EBITDA and -18.6% for EV/EBIT). Almost all countries behave similarly, with the sole exception of the increasing EV/Sales of UK and the EV/EBITDA and EBIT of Spain.
The downward trend is evenly spread among the 7 sectors considered in the analysis (table 3). The results show that the decrease is generalized and characterizes all the sectors: mainly healthcare (-43% of EBIT multiple) and technology (-30%), slightly utilities (-6,2%) and the basic materials (-7.8%). It is interesting to note that investors seem to penalize mildly sectors with more stable growth, lower volatility of earnings changes, much lower R&D to sales and a lower incidence of the intangible assets (utilities, basic materials as well as consumer goods). These elements are consistent with the idea that investors become more risk-averse during downturns, thus penalizing more intensely companies whose strategic and business risk are relatively high.
Deal multiples and target turnover
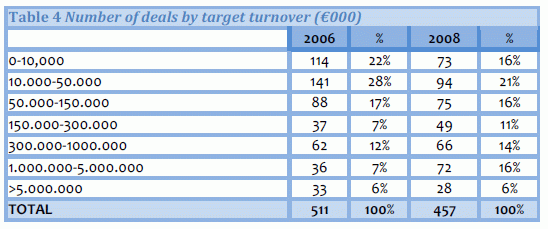
The sample has been divided in seven classes according to the turnover of the target firm, with the aim of exploring to what extent multiples change with the size of the target company (table 4). Each class of values contains an adequate number of firms (the minimum being set at 25 transactions).
While in 2006 the two smallest size classes contain the highest number and frequency of transaction (together covering 50% of the entire sample of transactions), the classes density changes in 2008, because the number of transactions involving bigger targets increases substantially (the 3 top classes covering 36% of the entire sample). The shift toward bigger transactions could be at least partially explained with a “flight to safety" tendency of the M&A activity in downturns. During a crisis, investors increase their risk aversion and thus become more reluctant to consider risky transactions like small deals. Ceteris paribus, the biggest the size of the target company, the lower the riskiness of the potential deal tends to be. Bigger companies have higher market shares, are more diversified, have more bargaining power with stakeholders (clients, suppliers) and are generally less leveraged than small companies. All elements that, in a turmoil, are positively considered by equity investors.
An additional factor concerning bigger deals is provided in Table 5, where it can be observed that the bigger the target size the higher the “discount” applied by the market. If we consider the EV / Sales of the 2 biggest dimension classes, the discount applied on bigger scale transactions is in fact substantially higher than the one applied on smaller deals.
A possible reason for this behaviour is probably given by the high difficulty of financing big deals during a credit crunch, in turn forcing the need of offering an economic incentive in terms of lower multiples. This rationale is particularly grounded in this crisis, which has determined a dramatic credit squeeze for companies and investors, thus also reducing the possibility of structuring transactions involving the acquisition of relevant equity stakes of big companies.
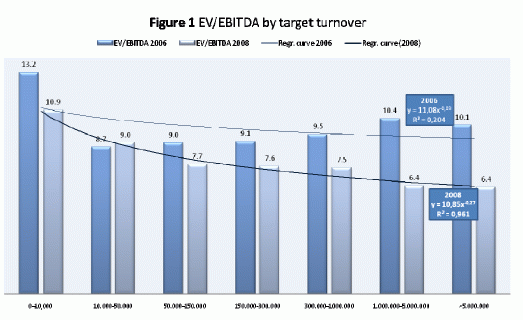
The evidence of a “big size discount” effect is further reinforced by considering Figure 1. It contains the regression analysis of the EV/ EBITDA for 2006 and 2008 against the logarithm of the target turnover, and it has the aim of checking the statistical significance of the relationship between multiples and deal sizes.
The regression line and equation show that multiples have been strongly affected by the size of the target company in 2008, while this effect has been weaker in 2006. A possible interpretation is that investors could become more selective in choosing their target during a crisis, penalizing small deals (which occur at higher multiples) while favouring big deals (carried out a lower multiples). In times of stock market frenzy, conversely, the market euphoria could push investors to be less selective and/or the credit market to offer investors more resources for financing bigger scale transactions (thus reducing the need of a size discount on big deals).
Deal multiples and stock market listing
An additional objective is to what extent multiples are also affected the target is either listed or privately held company. The assumption tested is if during a crisis transactions involving privately held companies could be penalize more intensely, by applying them a higher discount because of their lower liquidity. Liquidity could in fact be a key element of the transactions especially during downturns, as investors perceive the difficulties arising if investing in companies whose shares cannot be freely traded on a stock market.
As shown in Table 6, the sample of transactions is balanced between listed and unlisted companies and the frequency of these two classes does not change from one year to the other.
As it can be observed in Table 7, EV multiples decrease over the 2006-08 period for both group of companies. However, it is possible to observe that multiples of listed companies decrease less than those of private companies (-0.4% vs. -28.5% for the EBITDA multiple). A similar behaviour occurs for the other two multiples considered in the analysis, the EBIT multiples and the Sales multiple). The first one decreased, in fact, by 36.3% for unlisted versus 0.5% for listed, while the second decreased by 6.9% and 49.5% respectively.
Statistics : AN HISTORICAL STUDY : The giant deal: AOL-Time Warner acquisition
American Online’s acquisition of Time Warner in 2000-2001 is considered as one of the biggest M&A deals in the corporate history. The deal happened amidst lots of euphemism and fanfare. It was considered by many analysts to be a great move and a non formidable knot. But, much to the shock of everyone, the marriage could not last longer. It sunk like a torpedo hit ship pushing down the drain billions of shareholders money. There are many reports already available which explain the cultural differences and non-financial aspects which resulted in one of the history’s most bitter alliances. However there are not many of a kind which explain the financial aspects, this report compares the financial performance of both the companies’ pre-merger and post merger.
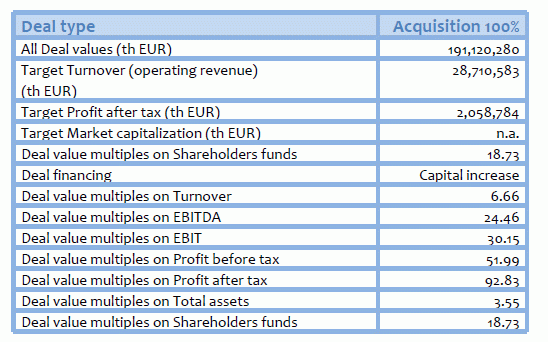
We begin with a brief company overview of both the companies involved in the deal. Then we delve a little deep into the numbers of the deal like deal value and deal multiples. We explained next what restructuring the new entity had to undergo because of the acquisition.
We then proceed to briefly explain the mismatched chemistry (non financial aspects) between the two high growth trajectory companies that were just seeing the fruits of the internet boom. In the later part, we have done a financial statement analysis whose results reflect the symptoms of a underperforming entity. We analyzed few ratios, revenue and profit figures and their growth for both the companies, prior to the deal and post the deal.
The end of twentieth century saw the internet revolution with large number of IT and internet based firms mushrooming up. Many internet based startups made billions of money riding high on the dotcom boom. Every company wanted to start its stores and operations online so as to cater to the growing number of online users. American Online (AOL) was one such company that grew at a fast rate selling internet based products and services.
On January 10, 2000, AOL announces that it has agreed to acquire Time Warner in a deal said to be the largest in history. The deal, described as a 'strategic merger of equals' will lead to the formation of AOL Time Warner Inc., the world's first Internet-Age media and Communications Company. Under the terms of the deal, AOL shareholders will receive 1 share in AOL Time Warner for each AOL share that they tender, and Time Warner shareholders will receive 1.5 shares in AOL Time Warner for each Time Warner share that they tender. Based on AOL's closing price of USD 73.00 on 07/01/00, the offer values each Time Warner share at USD 109.5. The offer represents a premium of 69.1 per cent over Time Warner's closing price of USD 64.75 on 7th January, 2000.
The offer values Time Warner's equity at USD 164.75 billion, and with the assumption of USD 17.2 billion of Time Warner debt, results in a total consideration of around USD 182 billion.
On completion, AOL's shareholders will own roughly 55 per cent of AOL Time Warner, and Time Warner's shareholders will own about 45 per cent. The deal is subject to approval by both sets of shareholders and regulatory bodies.
June 23, 2000: it is announced that the shareholders of both parties have overwhelmingly agreed to the merger, with 97 per cent of AOL shareholders and 99 per cent of Time Warner shareholders in favor of the deal.
On 11/01/01, after regulatory approvals had been granted, it was announced that AOL and Time Warner had successfully completed their merger. Since the deal was first announced AOL stock has fallen resulting in the consideration being valued at approximately USD 130 billion, including about USD 17 billion in debt. It gave birth to the world’s first integrated Media and Communications Company.
After the merger, the profitability of the ISP division (America Online) decreased. Meanwhile, the market valuation of similar independent internet companies drastically fell. As a result, the value of the America Online division dropped significantly. This forced a goodwill write-off, causing AOL Time Warner to report a loss of $99 billion in 2002 — at the time, the largest loss ever reported by a company. In 2003, the company dropped the "AOL" from its name, and removed Steve Case as executive chairman in favor of Richard Parsons, with AOL remaining a part of the company. That same year, Time Warner spun off Time-Life's ownership under the legal name Direct Holdings Americas Case resigned from the Time Warner board on October 31, 2005.
Time Warner (old) – now Time Warner Incorporation (ticker: TWX)
Historic Time Warner is an American media company that specializes in cable networks, publishing, music, filmed entertainment, cable and digital media. It provides prerecorded compact laser discs and cable television services. It is also involved in magazine publishing and sheet music publishing, as well as music licensing to radio stations, and motion picture production and distribution services. The company, formerly known as Time Warner Inc. was incorporated in 2001. Its corporate headquarters is located in New York City.
Historic TW is a part of Time Warner Inc., the world's leading media and entertainment Company that offers interactive services, cable systems, filmed entertainment, television networks and publishing services. These services are offered under the following brands: AOL, Time, CNN, CompuServe, Warner Bros., Netscape, Sports Illustrated, People, HBO, ICQ.
AOL Instant Messenger, AOL MovieFone, TBS, TNT, Cartoon Network, Digital City, Warner Music Group, Spinner, Winamp, Fortune, Entertainment Weekly and Looney Tunes. As part of the Time Warner Group, the company continues to provide the high-performance service, trustworthy information and enjoyable entertainment its audiences, members and customers expect.
American Online (AOL)
AOL is an American-based company engaged in the provision of Internet and communications services. It was established in 1985 as Quantum Computer Services. It is also previously known under the name America Online. Its registered headquarters is located in Dulles, Virginia.
AOL is identified as the world's largest Internet access provider with approximately 12 million subscribers in the United States and several million in Europe. Recognized as a leading global web services company, it owns one of the largest advertising networks in the United States with a suite of powerful web brands, such as MAPQUEST, icq, moviefone, Netscape.
Its proprietary network offers a wide range of content services, including communication tools, and online shopping. It has existing portals in France, the United Kingdom, Germany, and Canada, as well as in other parts of Europe and Asia.
The deal
The Merger was structured as a stock-for-stock exchange. Prior to the Merger, America Online and Time Warner formed a new holding company called AOL Time Warner and the new holding company formed two wholly owned subsidiaries. Upon the closing of the transaction, one subsidiary merged with and into America Online and one subsidiary merged with and into Time Warner. As a result, America Online and Time Warner each became a wholly owned subsidiary of AOL Time Warner.
As part of the merger, each issued and then outstanding share of each class of common stock of Time Warner was converted into 1.5 shares of an identical series of common stock of AOL Time Warner. Each issued and then outstanding share of common stock of America Online was converted into one share of common stock of AOL Time Warner.
As a result of the Merger, the former shareholders of America Online have an approximate 55% interest in AOL Time Warner and the former shareholders of Time Warner have an approximate 45% interest in AOL Time Warner, expressed on a fully diluted basis. The Merger was accounted for by AOL Time Warner as an acquisition of Time Warner under the purchase method of accounting for business combinations.
On December 31, 2000, the businesses of AOL Time Warner employed a total of approximately 88,500 persons, including approximately 32,000 persons employed by TWE. (AOLTimeWarner, 2000)
As on December 31, 2001, the businesses of AOL Time Warner employed a total of approximately 89,300 persons, including approximately 35,300 persons employed by TWE (AOL TimeWarner).
Deal aftermaths
In connection with the Merger, TWE has reviewed its operations and implemented several plans to restructure its operations. As part of the restructuring plans, TWE accrued an initial restructuring liability of approximately $210 million during the first quarter of 2001. The Company accrued an additional $91 million liability during the year as additional initiatives met the accounting criteria required for accrual. The restructuring accruals relate to costs to exit and consolidate certain activities at TWE, as well as costs to terminate employees across the various business units. Such amounts were recognized as liabilities assumed in the purchase business combination and included in the allocation of the cost to acquire Time Warner. Accordingly, such amounts resulted in additional goodwill being recorded in connection with the Merger. Of the total restructuring accrual, $107 million related to work force reductions and represented employee termination benefits. Because certain employees can defer receipt of termination benefits for up to 24 months, cash payments will continue after the employee has been terminated.
Termination payments of approximately $19 million were made in 2001. As of December 31, 2001, the remaining liability of $88 million was primarily classified as a current liability in the accompanying consolidated balance sheet.
The restructuring accrual also includes approximately $194 million associated with exiting certain activities, primarily related to lease and contract termination costs. Specifically, TWE plans to exit certain under-performing operations, including the Studio Store operations included in the Filmed Entertainment segment. The restructuring accrual associated with other exiting activities specifically includes incremental costs and contractual termination obligations for items such as leasehold termination payments and other facility exit costs incurred as a direct result of these plans, which will not have future benefits. Payments related to exiting activities were approximately $88 million in 2001. As of December 31, 2001, the remaining liability of $106 million was primarily classified as a current liability in the accompanying consolidated balance sheet.
Most significant advantage that front seat drivers of the deal have foreseen is the accessibility of Time Warner’s customers to AOL and vice versa. This symbiotic relationship is to encourage each company to market its extensive product and services mix to the other’s customers.
By the time the merger was completed a year later, the stock market was a few months away from collapse and confidence in the new company was receding. AOL Time Warner has struggled to live with its status as the world’s biggest media company. Despite a 100million strong subscriber base and a vast distribution network, it failed to capitalize on its immense existing content assets from its component businesses, choosing instead to concentrate its efforts on cross-promotional marketing activity, video-on-demand trials and digital music subscriptions.
All this is now seen as evidence that the company’s detractors may have been right all along. Often criticized for its poor service to dial-up subscribers, its nannying and censorious behavior, the ineptitude of its software and a huge spam problem, it now also appears to be a company whose management badly misread the market for its services. Following the report that the company had lost a staggering $99 billion in 2002, Steve Case, AOL’s chairman and founder, announced his departure from the company early in 2003.
Financial statement analysis
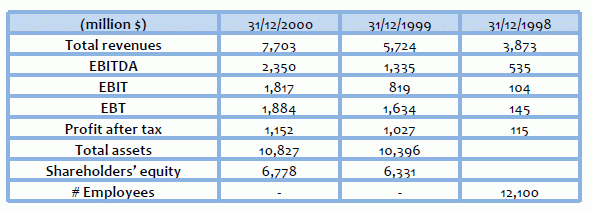
The table below shows AOL Time Warner financial performance after the acquisition. As it can be seen in comparison with the above tables, the percentage EBITDA margin of both the companies has been more than the same for the merged entity, a part of which can be attributed to the usual problems that piggyback on when two big companies merge to form a much bigger company.
Net Income margin was negative only in the initial years due to huge restructuring costs incurred because of the mammoth merger. However, a quite stable Revenues/Employee figure (except for 2002-03) indicates equal level of productivity for both the companies.
Stock market analysis
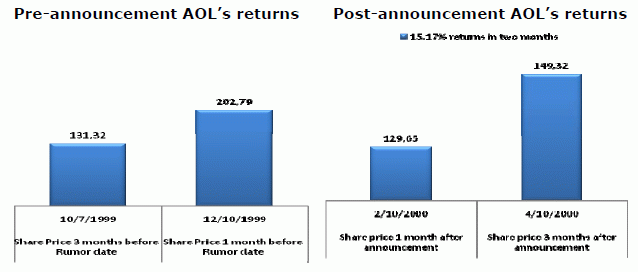
The percentage returns in two months interval of AOL have reduced to one third of its pre merger announcement returns. The market did not react very positively to the consolidation news which is not unusual for an acquirer company.
The above bar diagram indicates that:
1.AOL shareholders had 54.42% returns in the two months time frame prior to the deal announcement.
2.after the announcement of the deal, AOL shareholders only had 15.17% returns in the next two months which is only 1/3 the returns they got during the equal time frame prior to the announcement.
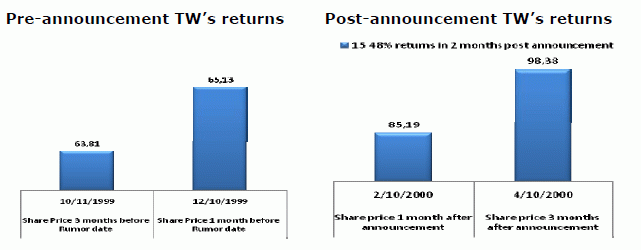
The above figure explains that a shareholder who has invested in Time Warner three months before the announcement of AOL must have got only 2.07% returns in the following two months. Upnext, Figure 7. explains how the same investor could have reaped 15.48% returns following the announcement in the next two months.
The percentage returns in two months interval for Time Warner has increased seven-fold its pre merger announcement returns in two months. The market reacted positively to the news about AOL’s acquisition of Time Warner which is again usual for the shares of a target company.
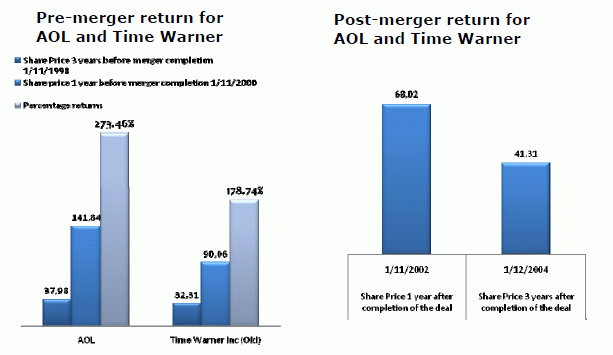
As can be seen from figures above, AOL Time Warner shares have given negative returns of 39.3% post merger as compared to the individual positive returns of 273% and 179% from AOL and Time Warner respectively prior to the merger.
Comparison with market performance and cumulative abnormal returns (CAR)
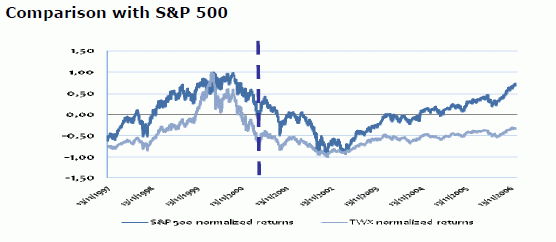
The following figure indicates the performance of Time Warner stock from 1997 to 2006 against the performance of the Standard and Poor composite 500 index.
The share price prior to the acquisition is for the acquirer company American Online which was traded on NYSE with ticker AOL. Post merger AOL Time Warner continued to trade with the same ticker till 2003. From 2003, AOL Time Warner decided to shed off the label AOL from its name and it changed its ticker to TWX.
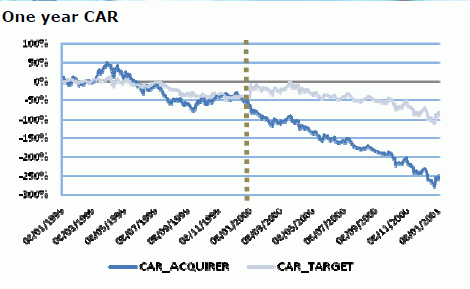
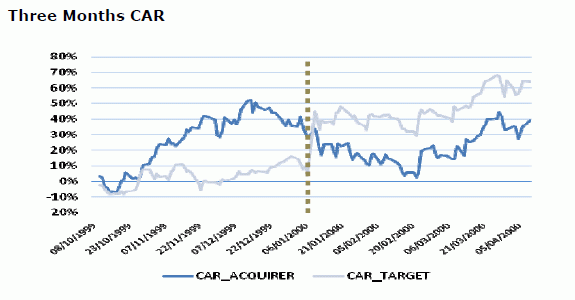
We have calculated here difference between the original returns that share holders received and the expected returns for the stock calculated using Capital Asset Pricing Model.
We used mean adjusted return method to calculate the expected returns for both the companies. Two years returns prior to the start of one year event window were used to calculate expected returns for one year CAR.
As we can see from the figure above, on the date of rumor, the cumulative abnormal returns for Time Warner have overshot by quite a high percentage as compared to American Online.
Research : The Life Cycle of Family Ownership: A Comparative Study of France, Germany, Italy and the U.K.
This research focuses on the evolution of the ownership of the top 1,000 companies, both private and listed in France, Germany, Italy and the U.K. over the period 1996-2006.
This paper makes three main contributions to the existing literature:
• first, it focuses on both listed and private companies, while existing studies have been restricted to listed companies only;
• second, it documents how ownership evolves over time. Existing research has provided little clue as to whether and how ownership might change;
• third, results provide support for the hypothesis that the trade-off between family control and widely held firms is different between outsider (like the U.K.) and insider systems (like France, Germany and Italy).
The authors conjecture that the likelihood and speed of transition from family firm to public corporation varies across countries. Families may be more likely to dilute control in outsider systems, where the value of the private benefits of control are lower, new equity is less expensive and the market for corporate control is more efficient. Conversely, families may be more likely to stay in control in insider systems, where the private benefits of control are greater, new equity is more expensive and the market for corporate control is less efficient. Since the U.K. is regarded as an outsider system and France, Germany and Italy as insider systems (see La Porta et al., 1997, Franks and Mayer, 1998, and Dyck and Zingales, 2004), we expect U.K. family firms to follow the life cycle theory of ownership more closely, by diluting control more rapidly than their Continental European counterparts.
Results are consistent with this prediction. Over the 1996-2006 decade, U.K. family firms have a lower chance of survival as family-controlled firms than French, German and Italian family firms. Only 44% of U.K. family firms survive over the decade as family controlled firms, compared with 74% in Germany, 64% in France and 78% in Italy. Similarly, we find a strong negative correlation between family control and age in the U.K., whereas we find no correlation between family control and age in the other three countries. A consequence of the lower level of aging in the U.K. is that the probability of observing second- or higher generation family ownership is lower in the U.K. than elsewhere.
Q&A : M&A: Seven steps to keep it safe
1.Don’t transfer your risk characteristics to the target firm
•The cost of equity used for an investment should reflect the risk of the investment and not the risk characteristics of the investor who raised the funds.
•Risky businesses cannot become safe just because the buyer of these businesses is in a safe business.
2.Render unto the target firm that which is the target firm’s but not a penny more
•As an acquiring firm, it is entirely possible that you can borrow much more than the target firm can on its own and at a much lower rate. If you build these characteristics into the valuation of the target firm, you are essentially transferring wealth from your firm’s stockholder to the target firm’s stockholders.
•When valuing a target firm, use a cost of capital that reflect’s the debt capacity and the cost of debt that would apply to the firm.
3.Beware of rules of thumb…
•Valuation is cluttered with rules of thumb. After painstakingly valuing a target firm, using your best estimates, you will be often be told that…
1. It is common practice to add arbitrary premiums for brand name, quality of management, control etc…
2. The target company is cheap if it trades at below some arbitrary value – 8 times EBITDA, 15 times earnings, PE less than the growth rate, below book value…
•The value of control is the difference between the firm run as is (status quo) and the value of the firm run optimally (stand alone value). Once you value control, you have to figure out how much of the control you are willing to concede to target firm stockholders and how much you will claim for yourself. As a general rule, you should try to lay claim to any part of control that you feel would be impossible to claim without your intervention.
4.Don’t pay for buzz words
•Through time, acquirers have always found ways of justifying paying for premiums over estimated value by using buzz words - synergy in the 1980s, strategic considerations in the 1990s and real options in this decade.
•While all of these can have value, the onus should be on those pushing for the acquisitions to show that they do and not on those pushing against them to show that they do not.
5.Don’t be a lemming
•All too often acquisitions are justified by using one of the following two arguments:
1. Every one else in your sector is doing acquisitions. You have to do the same to survive.
2. The value of a target firm is based upon what others have paid on acquisitions, which may be much higher than what your estimate of value for the firm is.
•The fact that everyone else in the sector is doing bad acquisitions and over paying for them is not a good reason to join the group. It is entirely possible that you are operating in a value destroying sector and it may be time for you to consider shrinking while everyone else is expanding or better still become a target of their acquisitions.
6.Don’t let egos or investment bankers get the better of common sense
•If you define your objective in a bidding war as winning the auction, you will win. But beware the winner’s curse.
•The premiums paid on acquisitions often have nothing to do with synergy, control or strategic considerations (though they may be provided as the reasons). They may just reflect the egos of the CEOs of the acquiring firms.
•The opinions of investment banks on the value of the deal itself are worth nothing (though they will charge you a substantial fee for offering them). Investment bankers make their money on the size of the deal and not on it’s quality.
•This is not a macho game. CEOs are all too willing to fight out acquisitions with other people’s money. Investment bankers are all too willing to go along.
•In a typical acquisition, who is watching out for the stockholders of the acquiring firm?
7.With acquisitions, recognize that the odds are against you
•Firms that do acquisitions often do so because they want to grow fast and at low cost. It is true that mature companies can buy growth companies and thus push up earnings growth, but at what price? If you pay too much for growth, your stockholders will be worse off…
•On average, the stock prices of acquiring firms falls on the date of the acquisition announcement by 3-4%.
•This is a very tough game to win at. When you decide to grow through acquisitions, especially of publicly traded firms, the odds are against you because you always have to pay the market price plus a premium. It is not who you buy that determines the success of an acquisition, it is how much you pay. The odds are better when you grow by buying private companies, where you assess the value and you are less likely to get into bidding wars. In addition, there are real constraints on private firms that my be removed when you take them over. This offers potential for increasing value.
For more on those M&A topics, please have a look on chapters 32, 42 & 43 of the Vernimmen.

