Letter number 53 of October 2010
ALL ARTICLES
- TOPIC
- STATISTICS
- RESEARCH
- QUESTIONS & COMMENTS
News : Debt and control premiums
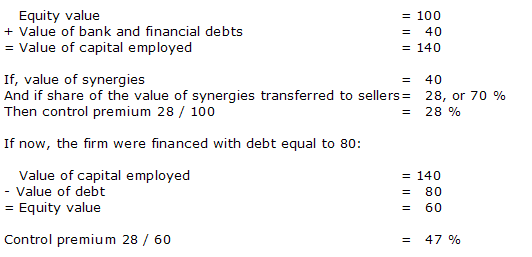
It is sometimes said that the more a firm is indebted, the higher the control premium paid when there is a change in the majority shareholder. The control premium is normally determined on the basis of the share of synergies that it is hoped will be created by the link-up, that the buyer is prepared to pass on to the sellers (1). The more the target company’s capital employed is financed by debt, the lower the firm’s equity value will be compared to the value of capital employed, and accordingly, the higher the ratio of synergies transferred / equity value, i.e., the control premium, may be.
So, if:
In his thesis, Mathieu Claro sought to confirm this assumption by looking at 4,216 company link-ups between 2000 and 2009 in the main OECD countries.
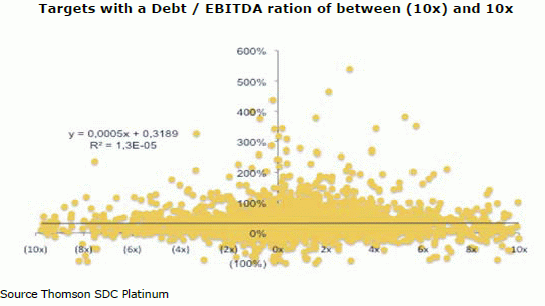
His findings show that you really need a magnifying glass to find any correlation between the premium paid and the financial structure of the buyer:
Even if extreme cases are eliminated, the figures show no correlation between net debt (measured by the debt / EBITDA or the debt / equity ratios) and the control premium paid.
Like Eugène Fama, we could say, “when the figures fail to back up the theory, then those figures must be wrong”.
It is in fact likely that the debt of a heavily indebted firm is not worth its book value, given the doubts over its solvency. Once there has been a change of control, however, the value of the debt increases sharply as a buyer would never buy a firm in order to let it go bankrupt shortly afterwards. This revaluation of the value of debt is certain, but it is not measured in this study as, by assumption, the value of debt was assumed to be equal to its book value, given that it is so difficult to estimate the discount on debt. Reabsorbing this discount that the buyer has to bear does not encourage the latter to be more generous in the amount of the premium offered, which would explain why our premise at the start of this article is not confirmed by the figures.
Michaël Jensen, the inventor of agency theory (2), suggests that as the size of debt acts as a disciplinary factor, highly indebted firms manage their assets very well. Accordingly, potential synergies (part of which is simply the better management of existing assets) are lower. Applied to lower equity capital, the control premium remains the same. This may be so. However, this will not dissuade us from the idea that if certain companies are carrying a lot of debt, it is because they are badly managed (see Thomson or General Motors) and not because shareholders wanted to put a bit of gentle pressure, through debt, on management!
It could also quite simply be that a firm that is carrying a lot of debt will frighten buyers who will obviously want to take a margin of precaution, and also that the shareholders of the target company are not necessarily in the best position to demand a higher premium, notwithstanding the fine theories that abound!
(1) For more details, see chapiter 42 of the Vernimmen.
(2) For more on agency theory, see chapter 31 of the Vernimmen.
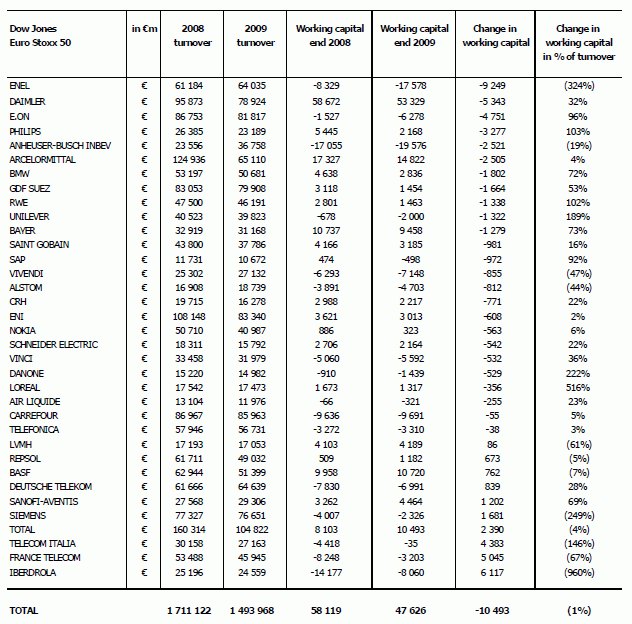
Statistics : Changes in working capital for groups of the Eurostoxx 50
- 17 of the 35 non financial / real estate members of the Euro Stoxx 50 had negative working capital end of 2009. Negative working capital is one of the attributes of a powerful group. So no one is surprised to find that 50% of the largest Euro groups enjoy negative working capital. As we have already written (1), the level of working capital is evidence of the relative strength of a group versus its customers and its suppliers. Food retail is not the only sector to have a negative working capital! Working capital for top European groups is now down to 7 days of sales.
-
•Most groups have reversed the sudden and sharp deterioration in their working capital at the end of 2008 as 25 out of 35 posted reduced working capital in 2009. This is due to a decrease in turnover (- 12% compared to 2008) but also to the end of a form of support of their customers / suppliers to help them to get through the end-of-2008 liquidity crisis.
-
Globally, changes in working capital totalled € - 19.7 bn, i.e. 1.3 % of total turnover.
(1) See chapter 11 of the Vernimmen.
Research : Why European firms carry out IPOs?
Research into finance often involves drawing up models to explain financial situations, and testing the predictions of these models using accounting and financial data bases.
The article that we present this month takes another approach – direct (and anonymous) questioning of financial directors. Results obtained are not as scientifically robust as the models method, since response rates are generally low (less than 5%) and there is some reason to doubt the sincerity of responses, even anonymous ones. It is, however, a good complementary exercise to scientific work, which is very useful, especially for international comparisons.
The article looks at IPOs of European firms (1). Bancel and Mittoo sent a questionnaire containing over 100 questions to 1,808 European firms that had listed between 1994 and 2004. They received 78 replies (a 4.3% response rate which is satisfactory for this type of survey). Their sample is sufficiently varied (size and characteristics of firms, stock exchanges and year of IPO) to be exploited.
The results are, for the most part, similar to those obtained for US firms (2). The most frequently cited advantage of going public (for 83% of financial directors), is the improvement of the firm’s reputation and visibility.
This is in line with the forecasts of Nobel Prize winner Robert Merton, who stated that greater visibility (especially among analysts) and a wider base of investors, enables listed firms to bring down their cost of capital (3). For 56% of those surveyed, listing led to improved negotiating powers with creditors.
The other advantage expected is the financing of growth. An IPO appears to be a normal step in a firm's development. This goal is acknowledged in 75% of cases (and the reduction of the rate of debt in 35% of cases). Firms that increase their capital at the time of the IPO are effectively those with the highest levels of growth. Nevertheless, the share of new shares in IPOs is relatively low (35% on average), with mostly existing shares being put on the market. The goal remains growth, but external growth – list the firm’s shares on the stock market and use them for M&A operations. The choice of stock exchange factors in this goal in more than 50% of cases.
An IPO also presents an exit opportunity for those holding capital in the firm. It enables them to sell their shares in several stages and often at a higher price than that obtained for unlisted firms. This objective is cited in 60% of cases and Bancel and Mittoo note that it is especially prevalent in the United Kingdom.
(1) F. Bancel and U.R. Mittoo (2009), Why do European firms go public ?, European Financial Management, vol.15, n° 4, pages 844-884.
(2) For example J. Brau and S.E. Fawcett (2006), Initial public offerings : an analysis of theory and practice, Journal of Finance, volume 61, n°1, pages 399-436.
(3) R. Merton (1987), A simple model of capital market equilibrium with incomplete information, Journal of Finance, volume 42, n°3, pages 483-510.
Q&A : How do we calculate the ROCE of a firm with a negative capital employed?
Firms with negative capital employed usually have a highly negative working capital requirement exceeding the size of their net fixed assets. This phenomenon is prevalent in certain specific sectors (contract catering, retailing, etc.) and this type of firm typically posts a very high return on equity.
Of the two roles played by shareholders’ equity, i.e. financing capital expenditure and acting as a guarantee for creditors, the former is not required by such firms. Only the latter role remains.
Consequently, return on capital employed needs to be calculated taking into account income from short-term financial investments (included in earnings) and the size of these investments (included in capital employed):
ROCE = [(EBIT + Financial Income) / (Capital employed + Investment)] x (1- Corporation Tax)
Nonetheless, firms in this situation factor their financial income into the selling price of their products and services. Consequently, it would not make sense to calculate capital employed without taking short-term financial investments into account. One again, financial logic wins the day!


