Letter number 90 of November 2015
- TOPIC
- STATISTICS
- RESEARCH
- QUESTIONS & COMMENTS
News : The financial analysis of US groups
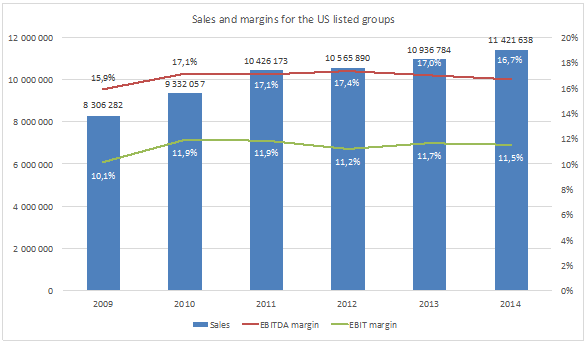
We regularly carry out a financial analysis of listed companies in different countries. You can find financial analyses of Chinese[1], Indian[2], Brazilian[3], Russian[4] and Japanese[5] groups in our previous newsletters. This month, we will be carrying out a financial analysis of US listed groups over the 2009-2014 period. The sample (homogenous over the 2009-2014 period) is made up of 2,742 non-financial groups representing a market capitalisation of $17,415bn (65% of the capitalisation of the NYSE and the NASDAQ) and aggregated sales of $11,421bn. For the record, and although not directly comparable, US GDP for 2014 stood at $17,419bn.
We used standard financial analysis methodology to analyse them[6]. Their financial statements were provided by Infinancials, a financial information company that also provides financial figures for 16,000 listed companies throughout the world, which appear on the homepage of vernimmen.com[7].
The creation of wealth ...
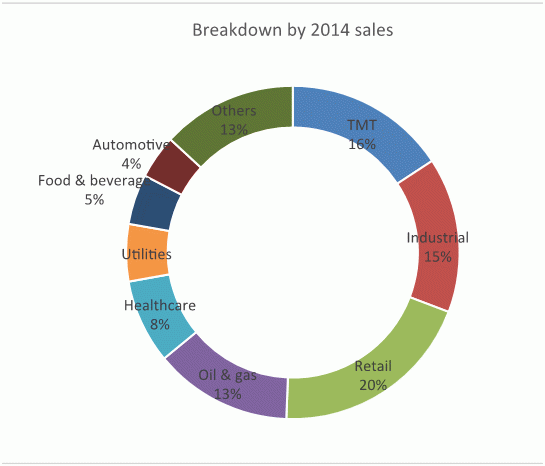
Historically the US economy has always been diversified with traditionally, industry and oil and gas accounting for a large share thereof. These days, the TMT sector (dominated by technology stocks) is also very important, representing 16% of the sample's sales (but nearly one-quarter of overall enterprise value).
US companies record very high growth rates over the period in question, their sales increasing by 38% between 2009 and 2014. A large part of this growth is achieved from 2011 (+26% compared to 2009). It is true that the first year of the period studied was in the middle of the crisis. In 2014, it was the health sector that recorded the fastest growth (9% of growth, part of which was through acquisitions), which explains the very high valuation multiples for this sector (EBITDA multiple of 16x) which facilitated external growth operations.
With an average margin of 17%, the EBITDA margin is higher than in China or Japan (close to 10-13%). The rebound in 2010 saw the return to comfortable margins (higher than 17%). This recovery can also be seen in the EBIT margin – just 10% in 2009 but higher than 11% over the remainder of the period.
This EBIT figure is one point higher than the EBIT of listed European countries (16.0% and 10.6% in 2014). A big thank you to Google, Apple and Facebook, with their fabulous margins (at least 30%) for which there are no equivalents of the same size among European media or technology companies.
... requires investments ...
Capital expenditures, which had fallen heavily in 2009 (although still representing 130% of depreciation and amortisation) rose sharply from 2010 and especially 2011, when they stabilised at 175-190% of depreciation and amortisation. Listed US companies were thus investing heavily, without counting investments in intangibles which are booked on the income statement.
Working capital was around 55 days of sales in 2014. We had been expecting less in a country where payment periods are traditionally relatively short, given the practice of offering a 2% discount for payment within 10 days, failing which at 30 days. This figure is less than the exceptional figure of 73 days of sales in 2009, when we can presume that listed groups were helping out their unlisted partners by offering them more favourable payment periods in a context of reduced liquidity.
... which need to be financed...
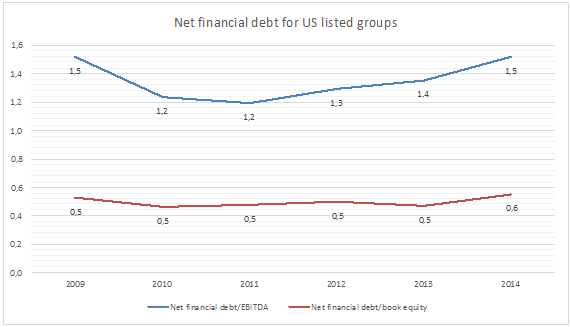
US groups are, on average, moderately in debt, with a net debt / EBITDA ratio of 1.5x in 2014. As in all economies, the level of debt depends largely on the sector and is significantly lower in the TMT sector (less than 1) than in the utility sector (higher than 4). We note that groups that were heavily indebted during the middle of the crisis (2009) with a ratio of 1.9 (mostly due to lower EBITDA) chose to deleverage in 2010-2012, before moving back to a more pro-active investment policy (especially in terms of external growth) from 2014. In 2014, the net debt / market cap ratio was 17%. So the US economy remains very much an equity-financed economy.
As we might have imagined, given the well-known situations at Apple or Google[8], US groups keep a lot of cash on their balance sheets ($1.726bn for our sample, which is 16% of their capital employed). This phenomenon is a result of the combination of a need for companies carrying debt (AT&T, Verizon) to show that they have a lot of cash and the reticence of groups that are cash-rich to return cash to shareholders (Google, Johnson & Johnson, Oracle, Cisco).Listed US groups pay out around 40% of their earnings in dividends, which is less than European countries, but these dividend pay-outs are complemented by share buybacks (there are higher volumes of share buybacks than dividend pay-outs).
... and must be profitable.
The average return on capital employed of US groups is good and higher than 3 points at an average cost of capital of around 8%.
But it is showing a tendency to decline, illustrated by the difficulty of sustaining ROCE higher than the cost of capital in the long term. Nevertheless, the satisfactory average does hide some major disparities:
- One-quarter of listed US companies recorded a 2014 ROCE of less than 7%;
- Half of listed US companies recorded a 2014 ROCE of less than 8.4%, i.e. a bit more than the cost of capital;
- One-quarter of listed US companies recorded a 2014 ROCE of more than 19.4%.
These disparities are explained by the fact that the US stock market is more open to companies that have not yet proved the viability of their economic model and also by the presence of heavyweights, specific to the USA, which are worldwide leaders with exceptional earnings. Companies like Google, Oracle, Johnson & Johnson, Cisco, Apple, UPC, IBM, Starbucks, Nike, Lockheed, Philip Morris, Microsoft, Boeing, etc., all post ROCE (after tax) of above 30%.
With a return on equity of 15%, listed US groups, on average, create value for their shareholders. Effectively, with a risk-free rate of 3% and a risk premium of around 6%, the required rate of return of US shareholders amounts to an average of 9%. At 15%, they’re delighted and rising share prices are a reflection of just that. Accordingly, the high level of valuations (2014 P/B ratio of 3.3x, 2014 EBITDA multiple of 10.7, 2014 P/E ratio of 23) is the combination of this value creation and the growth of US groups.
80% of this return on equity is explained by a good ROCE (of around 11%) combined with a leverage effect for the rest.
* * *
In conclusion, listed US companies enjoy good health and are highly resilient. Notwithstanding some volatility, they continue to grow at a sustained pace while at the same time creating value for their shareholders. They know how to use the leverage effect when this is relevant, but they keep a lot of cash on their books in order to be able to cope during potential hard times. One of the points that we think should really be noted is the strength of capital expenditures, proof that entrepreneurs and managers are confident about the future and allowing us to maintain a positive view of the US economy over the medium term. Which is something that is definitely lacking in Europe today.
Nevertheless, from a purely financial point of view, the US equity markets as a whole appear to be very well valued, with an average P/B ratio of 3.3, perhaps over-valued. Only 11% of US listed companies have a P/B ratio of less than 1 while 50% of them earn less than their cost of capital. One-third have a P/B ratio of more than 3 and one-fifth more than 5.
Statistics : LBO financing ratios to EBITDA in Europe
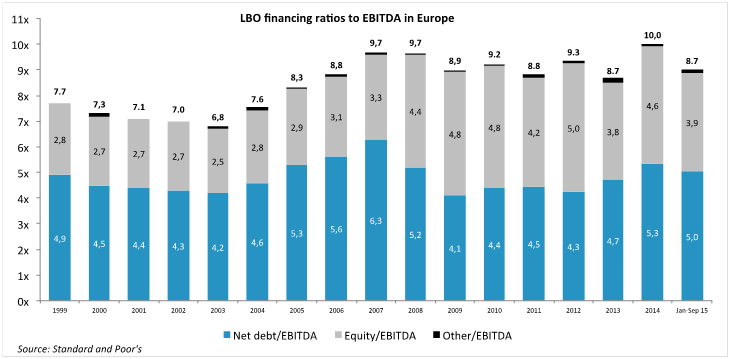
The financing terms for LBOs carried out in Europe in 2015, up to now, are half-way between the extremes of 2007 (high point) and 2009 (low point): debt is equal to 5x EBITDA (compared with 4.1 and 6.3), and equity contributes to 45% of financing (compared with 34% and 54%).
Research : The virtues of securitization
With Simon Gueguen – Lecturer-researcher at the University of Paris Dauphine
Securitization, even though it has become an important source of financing for firms, can result in negative effects. Articles on the subject have shown, in the case of mortgage-backed securitization (MBS) by financial institutions, that this practice can lead to a poorer selection of borrowers or obstacles to renegotiation in the event of problems. The article that we present this month[1] is very positive about asset-backed securitization (ABS) by non-financial firms. In fact, ABS makes it possible to reduce financial expenses, which results in an abnormally positive return for shareholders without any loss of value for creditors.
The virtues of securitization come from the separation of the risk of the securitized asset from the risk of the original company. This has two advantages. On the one hand, if the firm has a relatively high credit risk, it may not have access to all types of investors on the debt market, especially those who have restrictions on risky bonds. By isolating low risk assets in a special purpose vehicle and having the debt carried by this entity, the firm has access to more investors. In the case of segmented debt markets, this could bring down the cost of financing. On the other hand, separating an asset from the rest of the balance sheet reduces costs relating to financial stress.
This empirical study confirms this positive effect. Out of a sample of 231 firms that carried out securitizations between 1996 and 2009, the creation of value for shareholders (measured by the abnormal return surrounding the initiation of the securitization programme) is 1.09%. This is all the more noteworthy given that the recourse to other forms of external financing generally results in abnormally negative returns.
Another consequence of ABS, negative this time, could be an increase in the firm’s risk. The debt resulting from the ABS naturally has priority over the securitized asset in the event of default. Since securitized assets are most often assets carrying a moderate risk, it is possible that the firm’s creditors consider that the risk on the debt has increased and find that they lose out if renegotiation is impossible. In this case, part of the value obtained by the shareholders comes indirectly from a transfer on the part of the creditors. Lemmon et al reject this possibility for the sample studied. The abnormal return for the holders of bonds around the initiation date is very close to zero (-0.03%). And there is no significant downgrading of the credit rating in the following 90 days.
Lemmon et al also looked at the characteristics of the firms which have recourse to the ABS technique. In terms of credit rating, they note that firms with an average rating (BBB) are 50% more likely to initiate an ABS programme than firms rated A. Typically, firms with very good ratings do not often have recourse to ABS. Since they already have access to all investors, the advantages of this technique are limited for them. Similarly, firms with very low ratings do not use ABS, but for other reasons. Their creditors are wary of removing assets from the balance sheet and impose restrictions in loan agreements. Additionally, firms that securitize assets tend to be larger and to have more outstanding receivables (the type of asset that is often securitized).
In terms of securitization, a lot has been written about MBS. The interest of this article is that it takes a special (and positive) look at ABS, the advantages of which seem to outweigh the drawbacks.
[1] M.LEMMON, L.X.LIU, M.Q.MAO and G.NINI (2014), Securitization and capital structure in nonfinancial firms: an empirical investigation, Journal of Finance, vol.69, n°4, pages 1787 to 1825
Q&A : When calculating the ratio of working capital / turnover, should turnover be taken before or after VAT?
The problem raised here is the uniformity of the numerator (working capital) and the denominator (turnover). By construction, turnover on the income statement is pre-VAT, since although the company will be invoicing VAT to its customers, it passes this on to the tax authorities, so it does not get to keep the VAT that it collects. Working capital[1] groups together items on the balance sheet that are expressed excluding VAT such as inventories (since the company has not yet sold or consumed them) and others that are expressed including VAT because the company is invoiced VAT on its purchases (payables) or it invoices VAT to its customers (receivables).
Accordingly, there is no perfect solution since working capital groups together items that exclude VAT (inventories) and items that include VAT (receivables and payables). Taking turnover excluding VAT by just taking the figure straight off the income statement or taking it including VAT (i.e. by adding in VAT) is in any event wrong in both cases. If we want to be accurate and more rigorous, even though this will make things more complicated, we need see which, between the balance (receivables - payables) and inventories is the greatest and depending on the answer, to take turnover including VAT or excluding VAT as the denominator.
However, in the end it doesn’t really matter because when we measure the working capital / turnover ratio, we are less interested in the absolute figure that comes out of the calculation (which, in order to be accurate, requires the company's activity to be evenly spread throughout the whole year, which is rare) than we are in a trend. And the trend will be the same whether turnover is systematically taken including or excluding VAT. Of course, regardless of the choice, consistency is a must and there should be no changing of horses in midstream!


