Letter number 98 of November 2016
- TOPIC
- STATISTICS
- RESEARCH
- QUESTIONS & COMMENTS
News : Facebook
The Vernimmen now has its own Facebook page where every day you’ll find a quote, a short Q&A or comment on the latest financial news.
And if you like it, let us know by liking it!
It’s here:
News : Do German listed companies perform better than French companies?
In September, we analysed the financial statements of listed French companies[1]. This month, we use the same financial analysis methodology to present “Germany Inc.”, an aggregation of the financial statements of listed German companies.
We may as well say straight away that even though the French football team succeeded in beating Germany in the Euro 2016, this is not the case when it comes to the economic and financial performances of listed groups. Personally, as financial Frogs, we’d prefer it if the opposite were true!
In order to perform our analysis, we’ll use a standard financial analysis plan which can be summed up in a single sentence: the creation of wealth requires investments that must be financed and sufficiently profitable[2]. Our work is based on data provided by Infinancials.
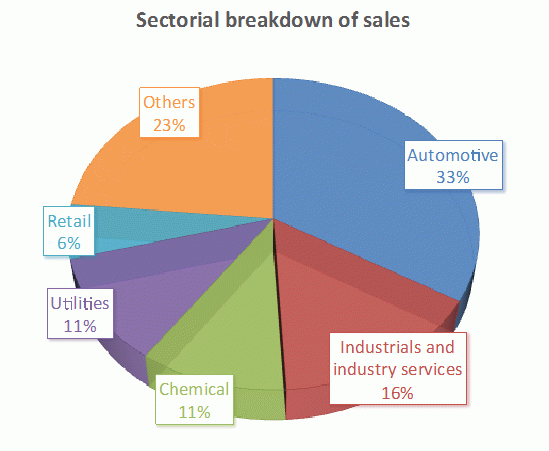
Germany Inc. is less diversified than France Inc. Its automotive industry is particularly large and accounts for one-third of its sales. On the other hand, retail, construction material and oil & gas groups are much less well represented than in France.
Given this large share of the automotive industry in the German economy, it’s hardly surprising that the Volkswagen affair quickly became a matter of national importance!
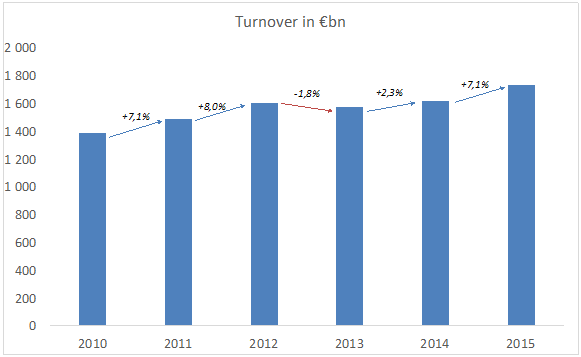
Germany Inc. grew by 4.5% per year over the 2010-2015 period (compared with less than 2% for France Inc.), so although aggregated sales were equivalent in 2010 at €1,380bn, sales for Germany Inc. in 2015 were €1,721bn compared with €1,513bn for France Inc.[3]. Which makes it one-nil to Germany.
We note in passing that, as one might expect, the average German company is smaller than the average French company, with unit sales lower by 25%. The German Mittelstand is not a myth.
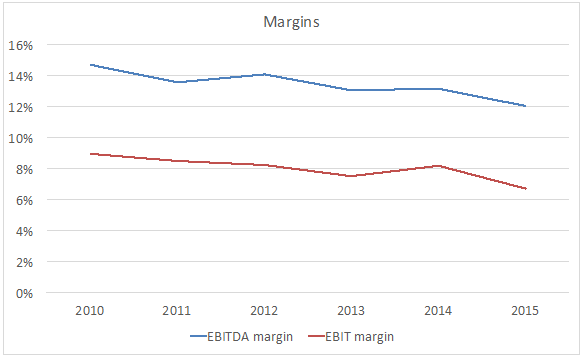
The observation we made on the margins of French listed companies also holds true for their German counterparts. EBITDA margins fall by 2.7 points from 2010 to 2015 (from 14.7% to 12.0%) and operating margins by 2.3 points (from 9.0% to 6.7%). Operating margins are slightly higher than those of French companies, although not by much (6.7% compared with 6.1%). Let’s call that a draw.
On the other hand, German companies are under much less pressure when it comes to taxation, than French companies. The average tax rate is 28% compared with 37% in France, a difference of almost 10 points. With identical operating margins, a German company will thus have more room for manoeuvre for investing or remunerating its providers of funds. And here we’re only comparing corporation tax, without being able to compare social security charges and miscellaneous taxes which are higher and more like fixed costs than variable costs in France.
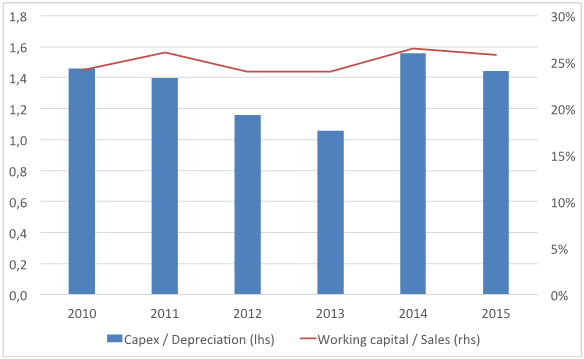
German Inc. likes to invest: capital expenditures are around one-third higher than depreciation and amortisation. This policy of proactive investing is what drives the growth in activity. On the other hand, France Inc., which only replaces its industrial base, has a much lower growth rate. There’s no smoke without fire. Another goal for Germany (and this one’s a beauty).
Working capital has, overall, remained stable as a percentage of sales. We note that it is materially higher (25% on average) than in France (less than 20%).
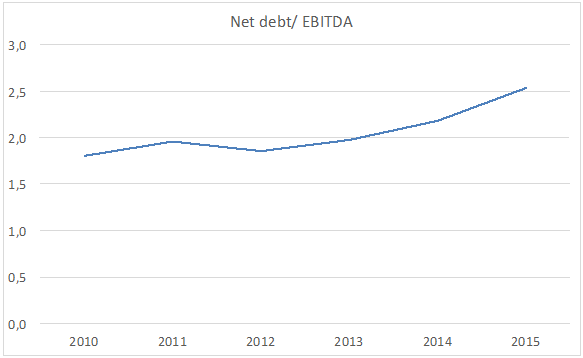
Germany Inc. finances a large share of its capital expenditure using debt. So, although the net bank and financial debt to EBITDA ratio was very reasonable in 2010 (1,8x, which is similar to the ratio for France Inc.), it rose significantly to reach 2.5x in 2015, while remaining stable in France. Should we read this as something to be worried about or rather as a sign of more confidence in the future?
Shareholders are also expected to play their part. The dividend payout amount is less than 50% so a large share of earnings is reinvested. Gearing (net debt/equity) thus remains stable at 1:1 over the period. France Inc. pays out more in dividends, which is only a logical follow-on given that it allocates less to capital expenditure! And make no mistake: it is not because French companies pay out more in dividends that they allocate less to capital expenditures, it is because they allocate less to capital expenditures that they pay out more in dividends.
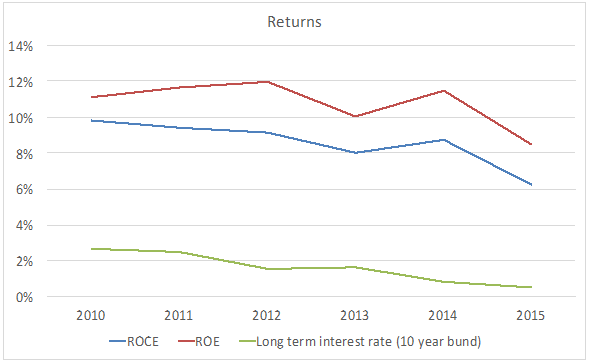
Overall, returns of listed German companies, like those of listed French companies, are down: -3.6 points for ROCE and -2.6 for ROE. The smallest drop in ROE is due to a growing leverage effect. The drop in ROE is more or less in line with the fall in long-term interest rates.
But, most importantly, it should be noted that Germany Inc. generates profits that are two percentage points higher than France Inc. (ROCE of 8.6% compared with 6.5%). These two extra points enable Germany Inc. to create value where one very much doubts that France Inc. could.
The price-to-book ratio is significantly higher at 1.7x, highlighting this value creation. These earnings that are higher than the cost of capital justify the lower dividends paid than in France where the opposite is true. Who wants to reinvest when the expectation is that money invested in this way is most likely to bring in less than it should, given the risk taken? Who wants to destroy value, i.e. who wants to lose money?
* * *
So, Germany Inc. is a company that records sustained growth and that invests in order to support this growth. Capital expenditure is financed equally by shareholders and lenders. Returns are declining as are earnings, but in a context of falling interest rates, this is hardly surprising or worrying. Listed German groups generate profits that remain sufficient for creating value.
[2] For more on the standard financial analysis, see chapter 8 of the Vernimmen.
[3] Note that even if we exclude energy companies in France, growth is only 3%
Statistics : Performance of the 10 top market capitalisations in the USA and in Europe since 1975
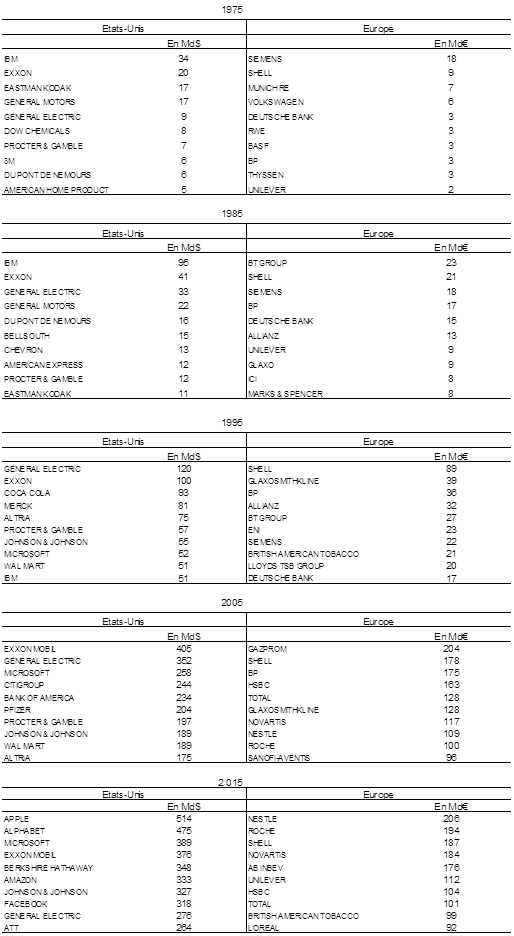
Forty years ago, the largest European group by market capitalisation was Siemens. Today, it is Nestlé, 11 times bigger with a market capitalisation of €206bn. And Gazprom, which was the leading European with €204bn in 2005 is today worth four times less with a market capitalisation of only €46bn (and it is no longer the largest group in Russia – sic transit gloria mundi).
But none of our 10 Europeans would rank among the 10 leading Americans, dominated by Apple (with a market capitalisation of $514bn), easily replacing 1975 leader IBM with a market capitalisation at that time of $34bn, which is sure to bring a smile to the faces of our readers who are also IT geeks.
Although Shell, General Electric and Exxon have been ranked among the US or European top 10 since 1975, the 2015 US list includes 6 new groups (out of 10, thus illustrating the Schumpeterian theory of value creation/destruction) including the 4 GAFAs, compared with 2 new arrivals in Europe (AB INBEV and L’Oréal).
We note that although the market capitalisation of the leading 10 US groups has increased by 12.9% per year on average since 1975, the increase in Europe is only 8.5%.
Looking back we can see how the economic fabric of Europe has changed, with seven heavy industry groups among the European top 10 in 1975, compared with two in 2015, and one light industry group in 1975 compared with six in 2015. This also explains why Germany, which occupied seven of the top 10 spots in 1975 (with zero for France) now has none (compared with two for France) and why Swiss groups occupy three of the top four places.
Research : Value or growth: what are the underlying factors of an investor's style
With Simon Simon Gueguen, lecturer researcher at Paris-Dauphine
It is usual to divide investment styles into two major categories: value and growth. A value investment involves identifying companies whose valuation ratios are not very high, in the hope of detecting shares whose market value is lower than their intrinsic value. A growth investment focuses on shares in companies with high growth potential, that invest large amounts in research and development, and that consequently have high valuation ratios. This month we look at an article[1] that tries to identify factors that are specific to investors and that influence their style of investment.
In this month’s article, Cronqvist et al boldly offer a partially biological explanation for investment behaviour. They use a research methodology that was developed on the frontiers of biology and social sciences to explain human behaviour. There is no consensus in the scientific community on the soundness of the way these studies were carried out or on their conclusions, so we’ll merely describe the method used and its results, leaving readers to form their own opinions. The other part of the explanation for behaviour is sought in investors’ life experiences.
For the biological part, the method involves looking closely at the behaviour of twins. Monozygotic twins (commonly called identical twins) share 100% of their genetic makeup, while dizygotic twins (fraternal twins) on average share only 50% of their genetic makeup. If we assume that the entourage (for example the parents) behave in the same way with monozygotic and dizygotic twins, and if the investment styles of monozygotic twins show greater similarity than those of dizygotic twins, then we assume that biology plays some role in this behaviour. This is effectively what Cronqvist et al took away from their study. To arrive at this conclusion, they looked at detailed data available on twins in Sweden (the Swedish Twin Registry). Their data base included over 10,000 monozygotic twins and over 24,000 dizygotic twins, all investors in the stock markets. They used the average price-to-earnings ratio (P/E ratio) of the investors’ share portfolios. A low ratio indicated a value investment style and a high value indicated a growth investment style. They arrived at a P/E ratio correlation coefficient of 0.49 for monozygotic twins and 0.35 for dizygotic twins. Other measurements made with the price-to-book ratio (P/B ratio) and with investments in mutual funds yielded similar results. Cronqvist et al concluded that there is a biological component to investment styles.
The rest of the article looks at individual characteristics (gender, age, economic status, etc.) and at the acquired part of behaviour, linked to life experiences. This is a very long article containing a large number of results and we’ll limit ourselves to citing the most notable ones here. The average P/E ratio of investors over 65 is 6 points lower (i.e. 39% of the median) than that of investors aged 25. This difference is considerable and is compatible with the idea that young investors have a longer investment horizon and that the growth style tends to be more commonplace in such cases. With regard to life experiences, individuals who grew up during the Great Depression (those born in the 1920s) have a more value-oriented approach (P/E ratio lower than 1.7).
Finally, this article attempts to identify a very large number of explanatory factors for investment behaviour. It is difficult to reach a conclusion on and to measure each of them, but the results show that factors specific to investors can help to explain their investment style and that these factors are extremely numerous. A few years ago we discussed an article in this newsletter[2] that established a link between the personality of company managers and their choice of financing. The approach here is comparable, but concerns individual investors. In both cases, a statistical link is established between individual characteristics and economic behaviour.
[1] H.CRONQVIST, S.SIEGEL et F.YU (2015), Value versus growth investing: Why do different investors have different styles?, Journal of Financial Economics, vol.117-2, pages 333 to 349.
[2] See «Over confidence and early life experiences», The Vernimmen.com newsletter of March 2013, n°73.
Q&A : Q&A posted on Facebook
Here are some questions sent in by readers with our answers that are now posted daily on the Vernimmen Facebook page.
Why are tax receivables and tax payables included in working capital?
Because this is a payment related to the company's business with a rather special supplier but a supplier nonetheless: the state which provides the company with services (roads, basic education level for employees, police, etc.) and is paid in taxes on which there may be a time lag between when they are due and when they are paid.
For more, see chapter 11 of the Vernimmen.
In the case of a tender offer on its own shares, is the redemption price offered by the company equal to the share price?
Generally in the case of a tender offer of a listed company on its own shares (the "offer"), the redemption price is set at 10-15% above the closing share price before the announcement to prevent, during the 15 days to 3 weeks that an offer lasts, and if the stock market falls, the price of the offer falling below the company’s share price which would lead to the failure of the offer.
There is no arbitrage possible because a company never buys 100% of its shares but 1 out of 10 or 1 out of 5, for example. So if I buy 5 shares on the market during the offer at the stock market price, there is only 1 that I am sure I will be able to sell at the offer price. The others will not be redeemed. They will be worth their post offer value. It is this uncertainty that makes arbitrage impossible. Especially since a share buyback does not create value in itself. The fact that a company pays a premium of 15%, for example, for 1 share out of 5 destroys value for the 4 other unredeemed shares whose value post offer should decrease by 15% / 4.
For more, see chapter 37 of the Vernimmen.
Can you explain why a family business that pays low dividends weakens the family’s control over the company?
In general, this issue arises not in the first or second generation but after the third when some members of the founding family no longer work for the company and therefore have less interest in it. They will start considering the investment in the family business as an investment much like another, and most other investments yield an income (rents for real estate, interest for bonds, dividends for shares). Meanwhile, in some countries, they may be subject to a wealth tax, so they need to receive dividends to deal with this tax and live a comfortable life. All this means that if the dividend is low, some family shareholders will want to sell their shares and recover the capital in order to maintain or improve their standard of living. Hence a weakening of family control.
For more, see chapter 41 of the Vernimmen.
A European group sells its Venezuelan subsidiary and uses the proceeds of the sale to fully repay its debt. Does its cost of capital stay the same?
The correct answer is that it decreases. By selling its Venezuelan subsidiary, the group restricts its activity to Europe and therefore to its least risky assets because it is very unlikely that the risk of its European activities is higher than that of its Venezuelan subsidiary. So this lowers its cost of capital since the cost of capital is determined by the market risk of its operating assets.
Too often, an error is made as people focus on the resources side of the business because of the most frequent method for computing the cost of capital (weighted average cost of debt and cost of equity). And looking at debt and equity, they forget to see that the cost of capital is a function of the risk of the company's operating assets. And that changing the financial structure of a business has never changed the cost of capital.
